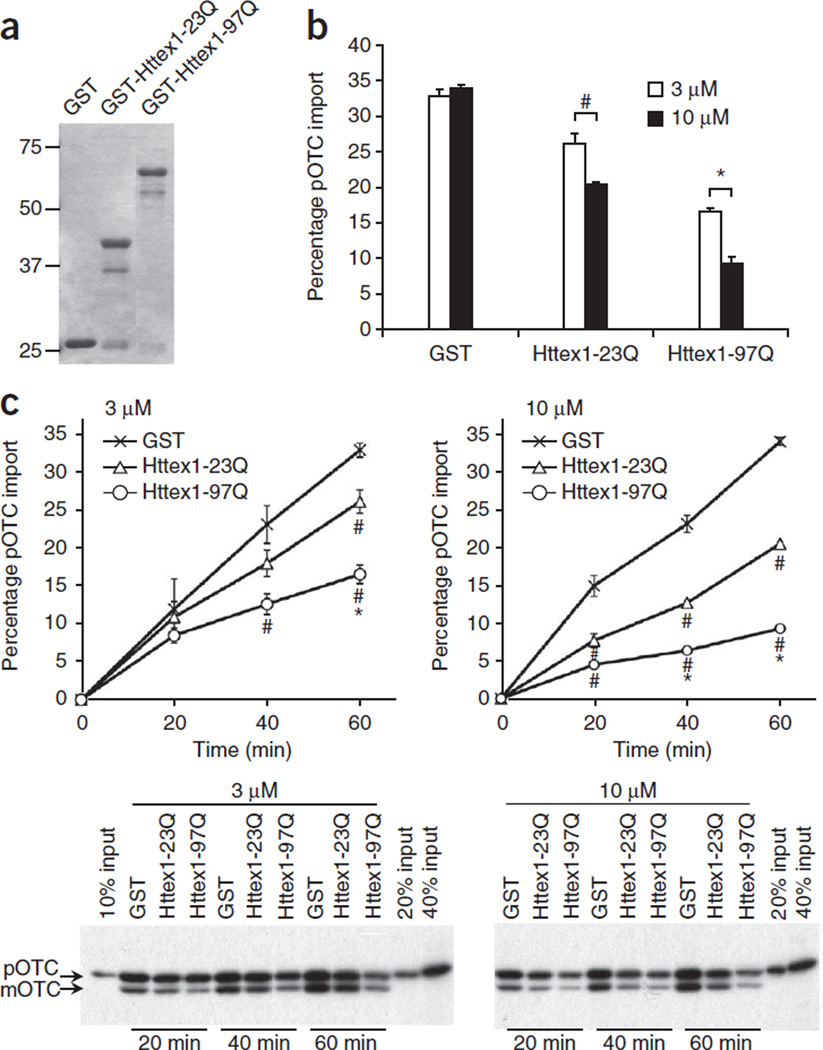
Figure 2.
Mutant Htt directly inhibits mitochondrial protein import. (a) Coomassie blue staining of GST fusion proteins used in b,c. (b) Forebrain mitochondria prepared from adult WT mice were preincubated with GST or GST-Httex1 proteins (3 or 10 µM) on ice for 1 h in 10 µl and then subjected to import assays by adding 40 µl import reaction buffer containing [35S]pOTC (60 min). Data are presented as mean + s.e.m. Inhibition of pOTC import by Httex1 proteins was dose dependent (#P = 0.001 and *P = 0.0001, F5,12 = 109.40). GST alone showed import activity similar to vehicle (phosphate-buffered saline), indicating no effect of GST on pOTC import (data not shown). (c) Kinetic analysis of pOTC import reaction after preincubation with indicated recombinant proteins as in b. Representative gel images used for quantification are shown. Import reaction times are indicated. Httex1 proteins decreased the import of pOTC into mitochondria in a polyQ length–dependent manner. # and * represent significant difference compared to GST and GST-Httex1-23Q at the given time point, respectively. 3 µM, 40 min: Httex1-97Q, #P = 0.008, F2,6 = 7.404. 3 µM, 60 min: Httex1-23Q, #P= 0.009; Httex1-97Q, #P< 0.0001, *P= 0.002, F2,6 = 43.28. 10 µM, 20 min: Httex1-23Q, #P= 0.002; Httex1-97Q, #P= 0.0002, F2,6 = 31.29. 10 µM, 40 min: Httex1-23Q, #P< 0.0001; Httex1-97Q, #P< 0.0001, *P= 0.0006, F2,6 = 153.73. 10 µM, 60 min: Httex1-23Q, #P< 0.0001; Httex1-97Q, #P< 0.0001, *P< 0.0001, F2,6 = 1,111.73. Data are presented as mean ± s.e.m. Percentage pOTC import (b,c) represents the percentage of mOTC radioactivity compared to input (total [35S]pOTC radioactivity added to each reaction). One-way ANOVA, Bonferroni t-test. n = 3 independent experiments (b,c). Full-length blots/gels (a,c) are presented in Supplementary Figure 9.

