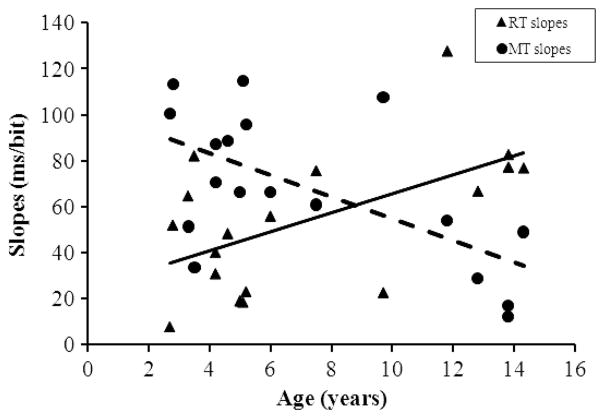
Figure 3.
Each symbol indicates the slope of the reaction time (RT; triangles) or movement time (MT; circle) per bit function for each individual. These slopes are plotted on the graph as a function of the age of the participants. The two lines indicate the linear fits for the RTs (continuous line) and MTs (dashed line) slopes as a function of age.

