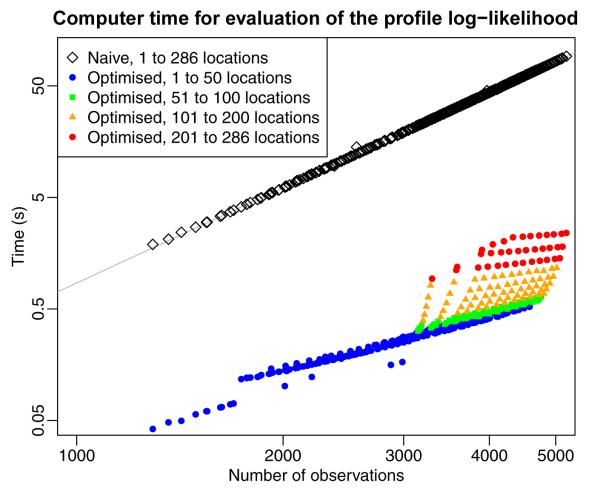
Figure 4.
Comparison of the time needed for one evaluation of the naïve profile likelihood (9) and simplified version (10). The full dataset, 5182 observations from 286 locations and 280 time points, was divided into smaller pieces by dropping either locations and/or time-points to examine how fast the evaluation time would grow as the dataset was expanded. Evaluation time for the full likelihood grows as N2.8 (the fitted line) close to the expected theoretical value of . For a fixed number of locations evaluation time for the simplified version grows considerably slower than N3.

