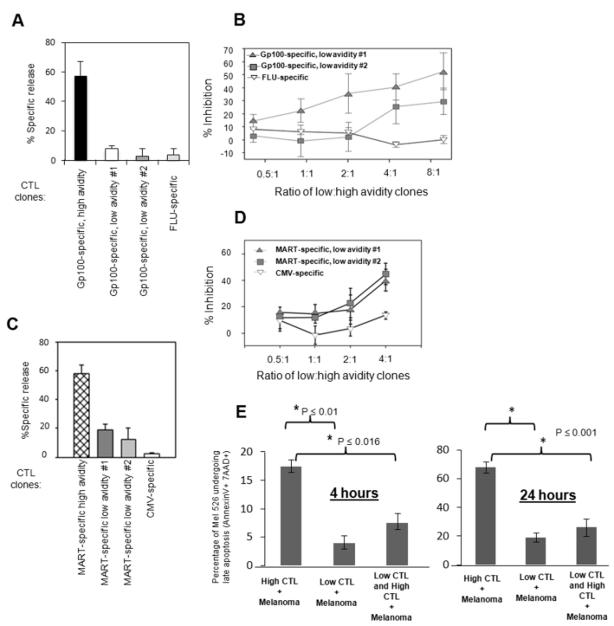
Figure 1. TAA-specific low avidity CTL can inhibit lysis of melanoma cells by high avidity CTL.
(A) and (B): Gp100-specific CTL clones. C and D: MART-specific CTL clones. (A) and (C): High and low avidity CTL clones vary greatly in efficiency at tumor cell lysis, (B) and (D): High avidity CTL lysis of tumor cells can be inhibited by pre-incubation of tumor cells with non-tumor lytic low avidity CTL. For each assay in B and D, 104 51-Chromium(Cr)-labeled mel526 melanoma cells were combined with 5×10⁴ to 8×10⁵ low avidity TAA-specific or virus antigen- specific CTL by centrifugation at 200xg and incubated 1.5 hours before addition of 105 high avidity TAA-specific CTL to a final volume of 200 μl. This was followed by additional 1.5 hour incubation. For assays in A and C, low avidity cells were substituted with and equivalent volume culture medium. Forty μl cell-free supernatant was harvested and percent specific release (PSR) of 51- Chromium calculated. Calculation of percent specific release was described previously (6). Percent inhibition was calculated by the formula: 100 × (PSR(high avidity + mel526) − PSR(high + low avidity + mel526))/ PSR(high avidity + mel526). Bars reflect standard deviation between assays in three separate experiments. (E) Changes in expression of apoptotic markers 7AAD and Annexin V on mel526 target cells at 4 and 24 hours. Bar graph illustrates the percent change in apoptotic markers for each group (4 hour time point; High vs. Low; p ≤ 0.01, High vs. Low + High; p ≤ 0.016) and (24 hour time point; High vs. Low; p ≤ 0.01, High vs. Low + High; p ≤ 0.01). Assays were performed in triplicate.

