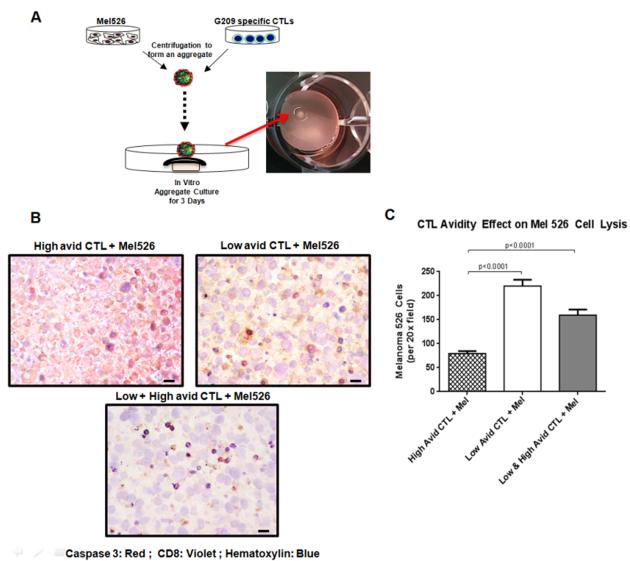
Figure 3. Visualizing CTL cross-inhibition in three dimensional (3D) culture system.
(A) Schematic of generating mel526/CTL aggregates for in vitro models. Cultured mel526 cells (2 × 10⁵ cells) plus either high (1 × 10⁵) or low (1 × 10⁵) avidity CTLs or combination of high and low avidity CTLs cells were mixed to form aggregates. Aggregates were then cultured on nucleopore membranes floating in DMEM medium supplemented with 10% FBS for 48 hours for in vitro analyses. (B) Paraffin embedded aggregate tissue sections from each group were analyzed for expression of melanin A (brown), haematoxylin (blue), and caspase 3 (red). Shown are representative sections. See “Materials and methods, Histologic analyses” for image acquisition information. (C) Bar graph representing the viable cell count of tumor aggregates. Counts were determined from the paraffin embedded sections of each aggregate imaged at 20x. Mean cell counts for 6 independent areas of each aggregate are reported. Unpaired t-test of the data groups was performed and statistical significance was given for p<0.05.

