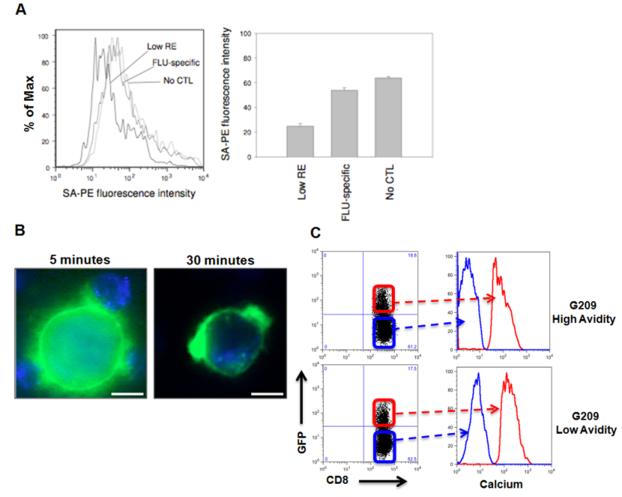
Figure 4. Low avidity CTLs reduce specific peptide-MHC complexes on the surface of tumor cells.
(A) Changes in biotin-tagged cognate peptide levels analyzed for stripping from the surface of target cells by low avidity CTL. Remaining cognate peptide concentration analyzed by flow cytometry for streptavidin (SA)-PE fluorescence intensity. (B) To visualize trogocytosis, immortalized B-cells expressing HLA-A*02:01 coupled to GFP (HmyA2GFP cells) were pulsed with G209n-specific peptide and incubated with G209n-specific low avidity CTLs. Formation of clusters between CTLs and HmyA2GFP cells were visualized via live cell fluorescent microscopy at 5 min (left panel). Small membrane fragments of HLA-GFP expression on the surface of CD8+ T cells appeared after 15 to 30 minutes (right panel). (C) An increase in intracellular calcium concentration is directly associated with both high and low avidity CTLs undergoing trogocytosis. HmyA2GFP cells were pulsed with G209n peptide (1ng/ml) and incubated with either G209n high or low avidity CTLs for 7 minutes. Following incubation, GFP+CD8+ cells were gated and compared to GFP-CD8+ cells for the levels of intracellular calcium concentration.

