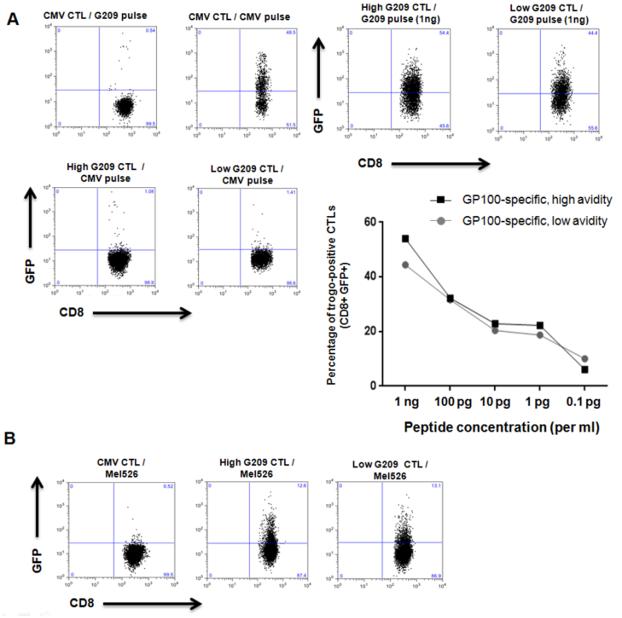
Figure 5. Level of trogocytosis is dependent on antigen specificity and peptide concentration and is equal in low and high avidity CTL clones.
(A) FACS analysis showing the percent of trogocytosis of both high and low avidity CTL clones specific for G209n at 1ng/ml. Line graph shows increasing concentrations of G209n peptide on APCs show greater levels of trogocytosis for either CTL group. FACS analysis showing the levels of trogocytosis when incubating G209n specific high and low avidity CTLs with PKH67 labeled mel526 melanoma cells. (B) We used CMV specific CTLs as a control for measuring G209 specific trogocytosis in both pulsed HmyA2GFP and Mel526 cell line. The figure highlights peptide specificity of trogocytosis and the inability of CMV specific CTLs to undergo trogocytosis when incubated with Mel526 cell line.

