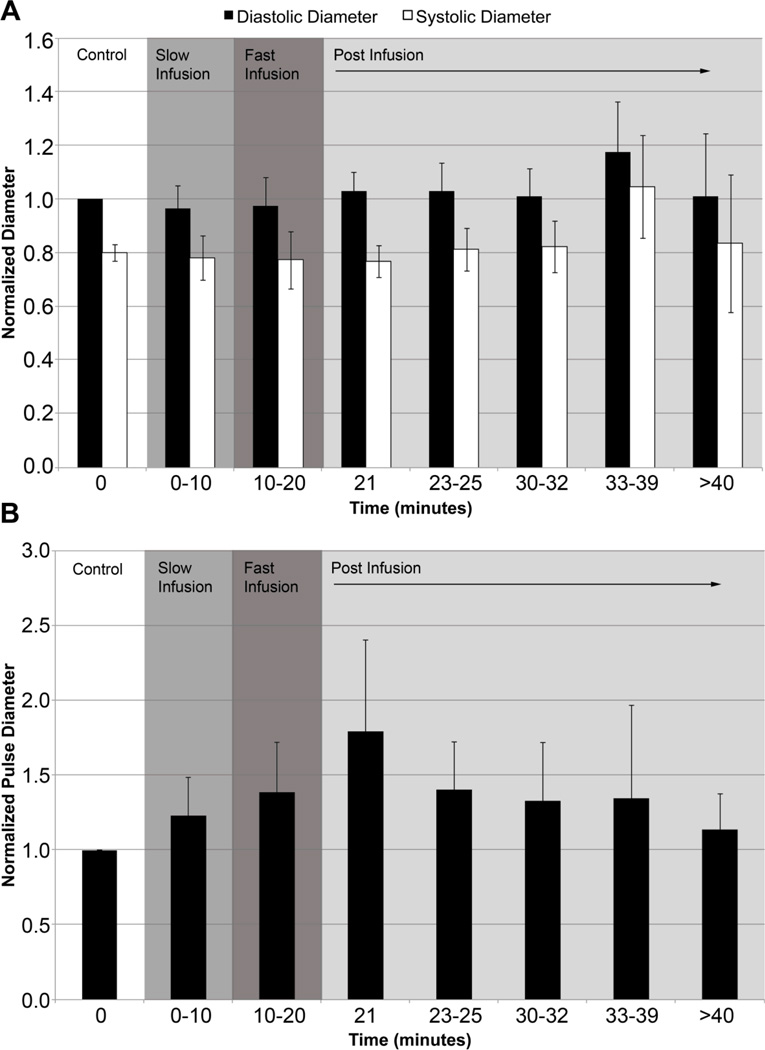
Figure 1.
Plots of normalized Dd, Ds and pulse diameter. (A) Diastolic (black) and systolic (white) diameters were normalized to the control diastolic diameter. (B) Normalized pulse diameter over the entire duration of the experiment. Changes in diameter were not statistically significant (p-value>0.05).

