
Figure 5.
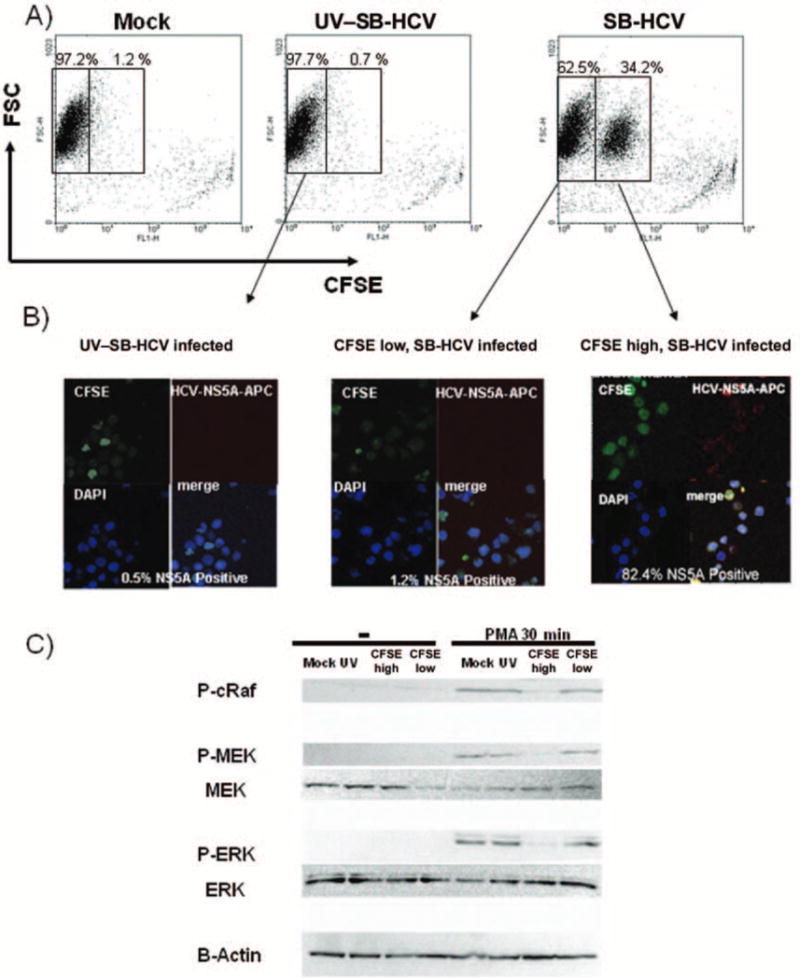
Effects of hepatitis C virus, strain SB (SB-HCV), infection on cell proliferation in Molt-4 cells. A, Representative fluorescence-activated cell sorter (FACS) analysis of cell proliferation. B, Carboxyfluorescein succinimidyl ester (CFSE)–high and CFSE-low groups were separated by FACS analysis and analyzed for NS5A expression by immunofluoresence analysis. Green stain, CFSE; red stain, NS5A; blue stain, 4′,6–diamidino–phenylindole dihydrochloride (DAPI). The percentage of infectivity was determined by counting numbers of positively stained cells per 400 cells. For the negative control, cells treated with UV-irradiated HCV and detection antibody alone were used. C, Analysis of Ras/mitogen-activated protein (MAP) kinase/extracellular signal-regulated kinase kinase (MEK)/extracellular signal-regulated kinase (ERK) signaling. For details about immunoblotting analysis, see Methods. Three independent experiments yielded similar results. FSC, forward scatter characteristics; P-cRaf, phospho-cRaf; P-ERK, phospho-ERK; P-MEK, phospho-MEK.