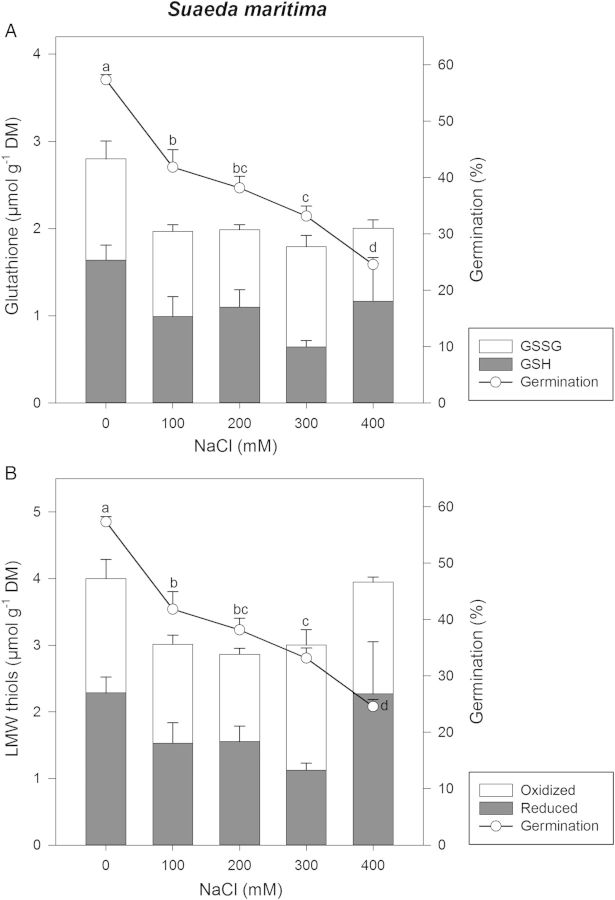
Figure 5.
(A) Reduced GSH (grey bars) and GSSG (white bars) in germinated seeds of S. maritima. Line plot indicates viability of seeds as determined by germination test. Germination values are shown as mean ± SE. Different letters indicate significant differences of the mean. (B) Reduced concentration of the LMW thiols glutathione + cysteine + cysteinyl–glycine + γ-glutamyl-cysteinyl (grey bars) and their oxidized forms (white bars) in germinated seeds of S. maritima. No significant differences in the concentration of LMW thiols (reduced, oxidized and total) were seen with increasing NaCl. Line plot indicates viability of seeds as determined by germination test. Germination values are shown as mean values ± SE. Different letters indicate significant differences of the mean.

