
Figure 3.
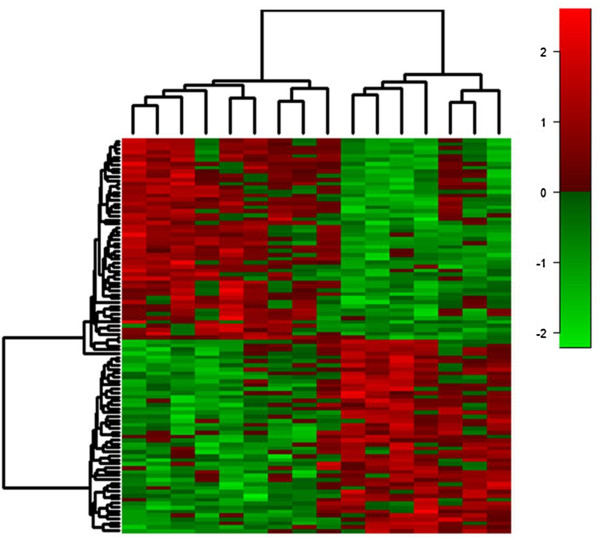
Differential expression of top 100 genes (p < 0.002) pre- and post-dietary intervention. Based on analysis of the top differentially expressed transcripts, it is clear that transcription expression is changed over time, with expression being both increased (red) and decreased (green) significantly in just 6 weeks.