
Figure 5.
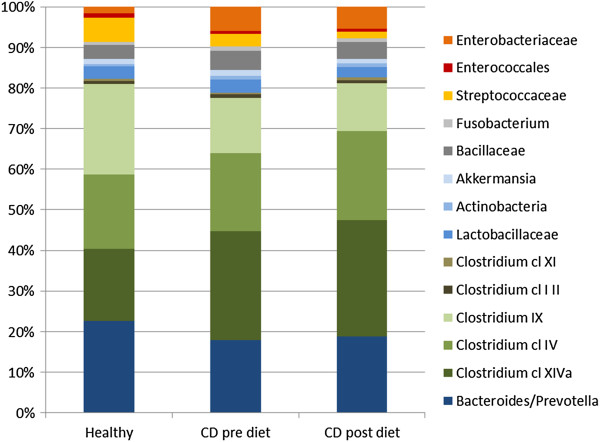
Relative abundance of microbiota pre- and post-dietary intervention. Healthy samples (n = 2), CD pre-diet (n = 8) and CD post-diet (n = 8).
Official websites use .gov
A
.gov website belongs to an official
government organization in the United States.
Secure .gov websites use HTTPS
A lock (
) or https:// means you've safely
connected to the .gov website. Share sensitive
information only on official, secure websites.
Relative abundance of microbiota pre- and post-dietary intervention. Healthy samples (n = 2), CD pre-diet (n = 8) and CD post-diet (n = 8).