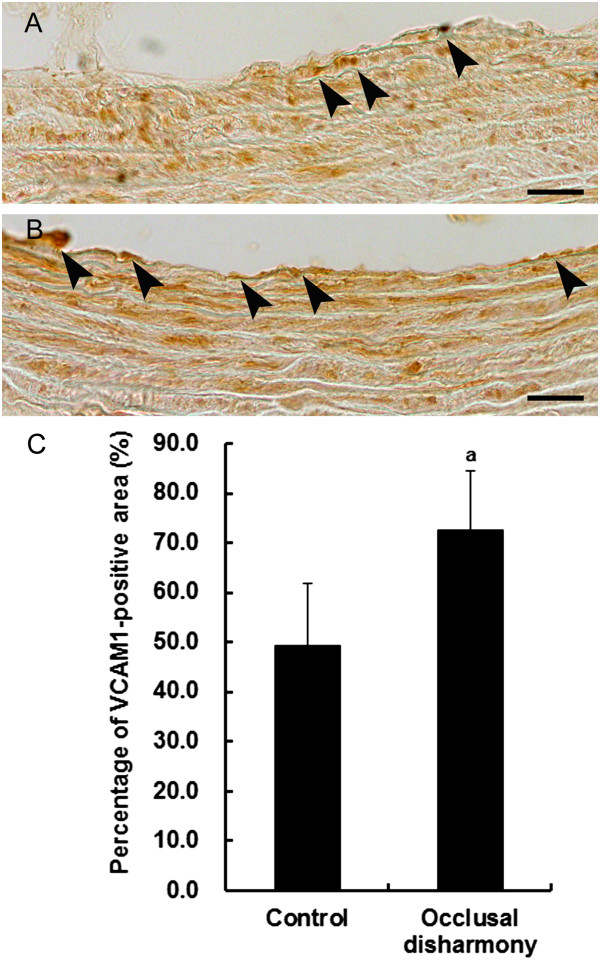
Figure 3.

Vascular cell adhesion molecule-1 (VCAM1) expression in cross sections of descending aorta. VCAM1 expression in endothelial tissue (arrowheads) in the occlusal disharmony group (B) was more intense than in the control group (A). Scale bar = 25 μm. Percentage of VCAM1-positive lumen (mean ± SD) in the occlusal disharmony group was significantly higher than that in the control group (C). a p < 0.05, vs. control group, according to t-test (n = 7).
