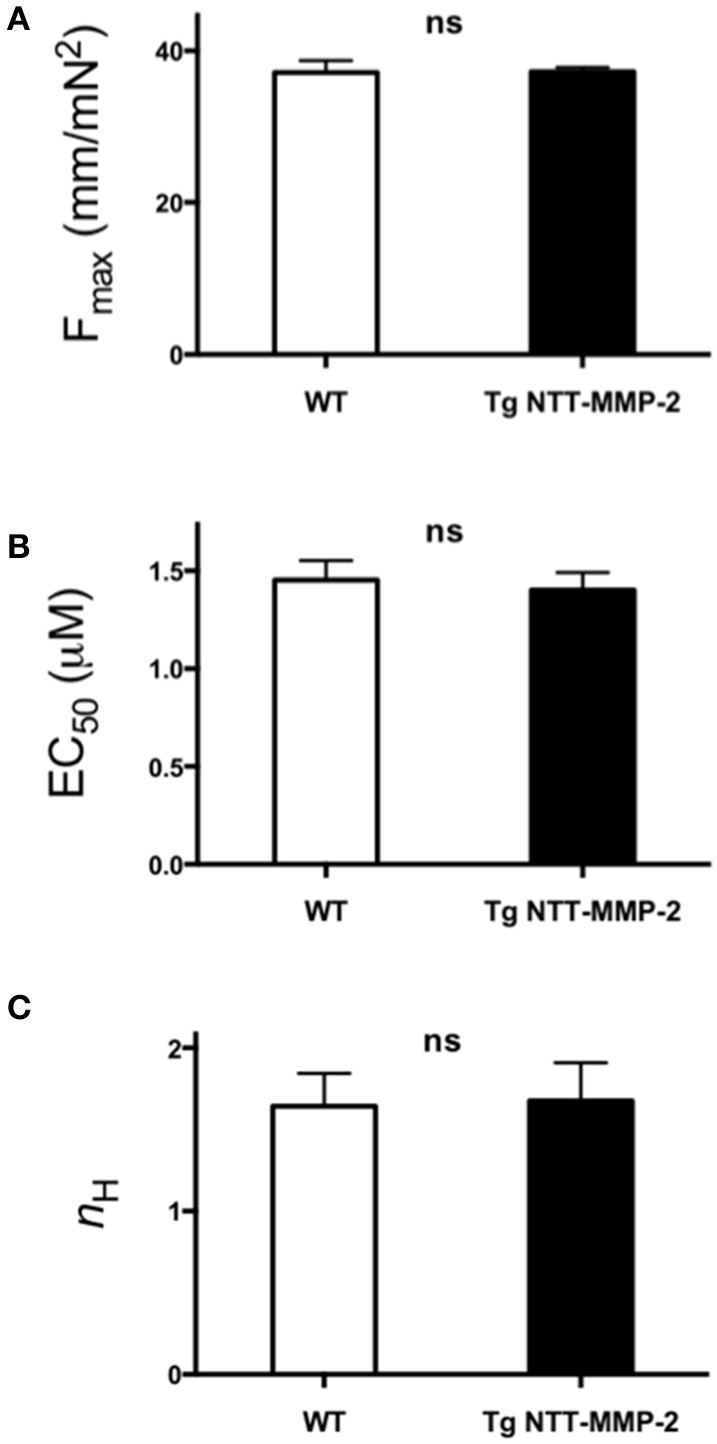
Figure 4.

Pooled data of Hill parameters derived from fitting the force-Ca2+ relationship for individual experiments to the Hill equation. (A) Fmax (maximum Ca2+-activated force). (B) Ca2+ sensitivity EC50 ([Ca2+] at 50% Fmax). (C) Hill coefficient nH (slope of Ca2+-force relationship at EC50). For all Hill parameters, no statistical differences were found between NTT-MMP-2 vs. wild type (P ns, Two-Way ANOVA; mean ± SE, n = 4/group).
