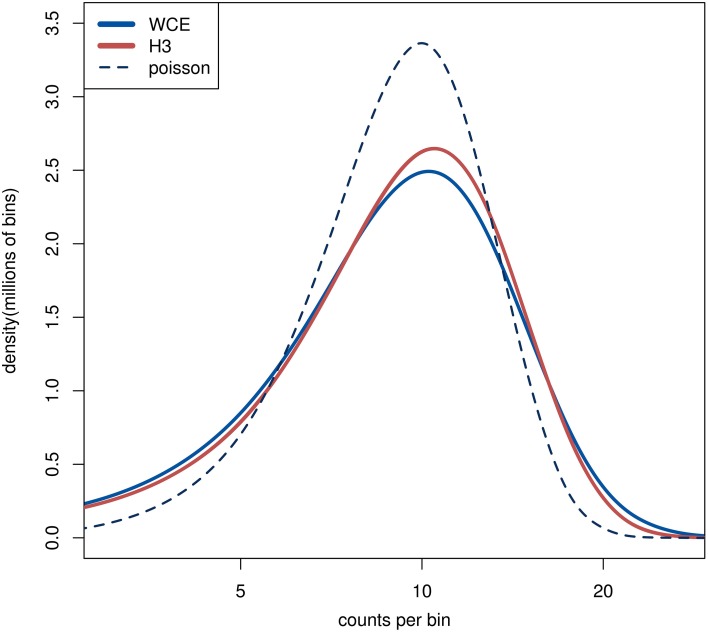
Figure 1.
The distribution of read counts in 1 kb bins over the genome. The lines from the two H3 samples are completely overlapping. The dashed line is from a random sample where the reads are distributed independently with equal probability for each bin. The curves are smoothly interpolated between the discrete data points.

