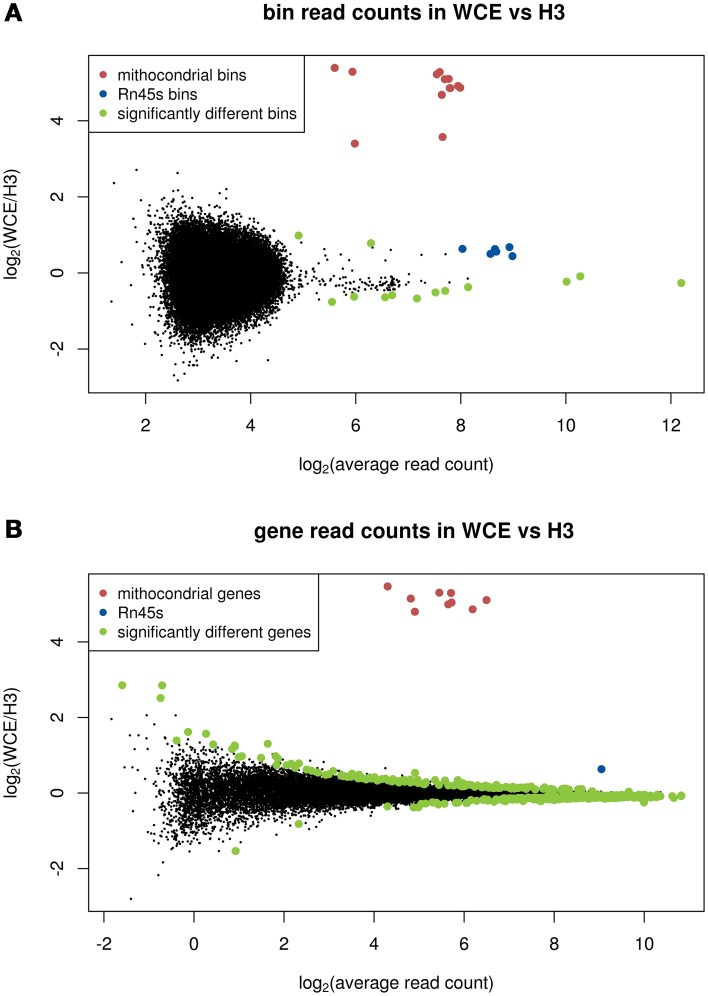
Figure 2.
MA plots comparing enrichment between WCE and H3: (A) 1 kb bins across the genome, (B) bins that span genes. Significantly different bin counts between samples are highlighted and Rn45s and mitochondrial bins (all significantly different) are highlighted in blue and red, respectively. Significance is defined as FDR below 0.05 in a limma-voom analysis.

