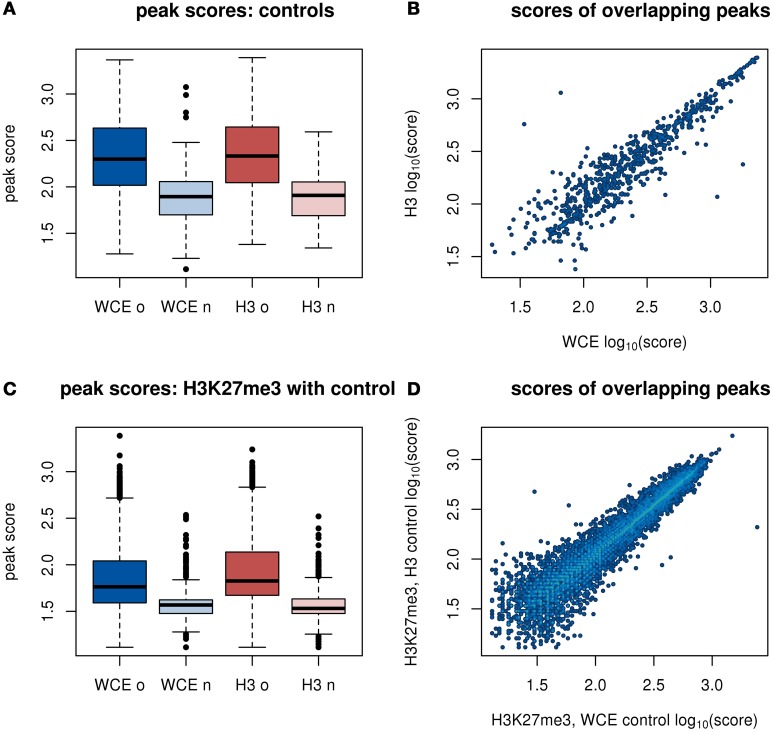
Figure 3.
Peak scores from a MACS analysis of enriched regions. H3 and H3K27me3 replicates are merged before analysis. (A) Distributions of scores of peaks in WCE and H3. The peaks in each control are split into peaks that overlap between the two background samples (marked with “o”) or do not overlap (marked with “n”). (B) Scatter plot of scores of overlapping peaks from the WCE and H3 sample. (C) Distributions of scores of peaks in H3K27me3 with either WCE or H3 as a control. Labels on the x-axis refer to the control sample. (D) Scatter plot of scores of overlapping peaks from H3K27me3 with either WCE or H3 as control.

