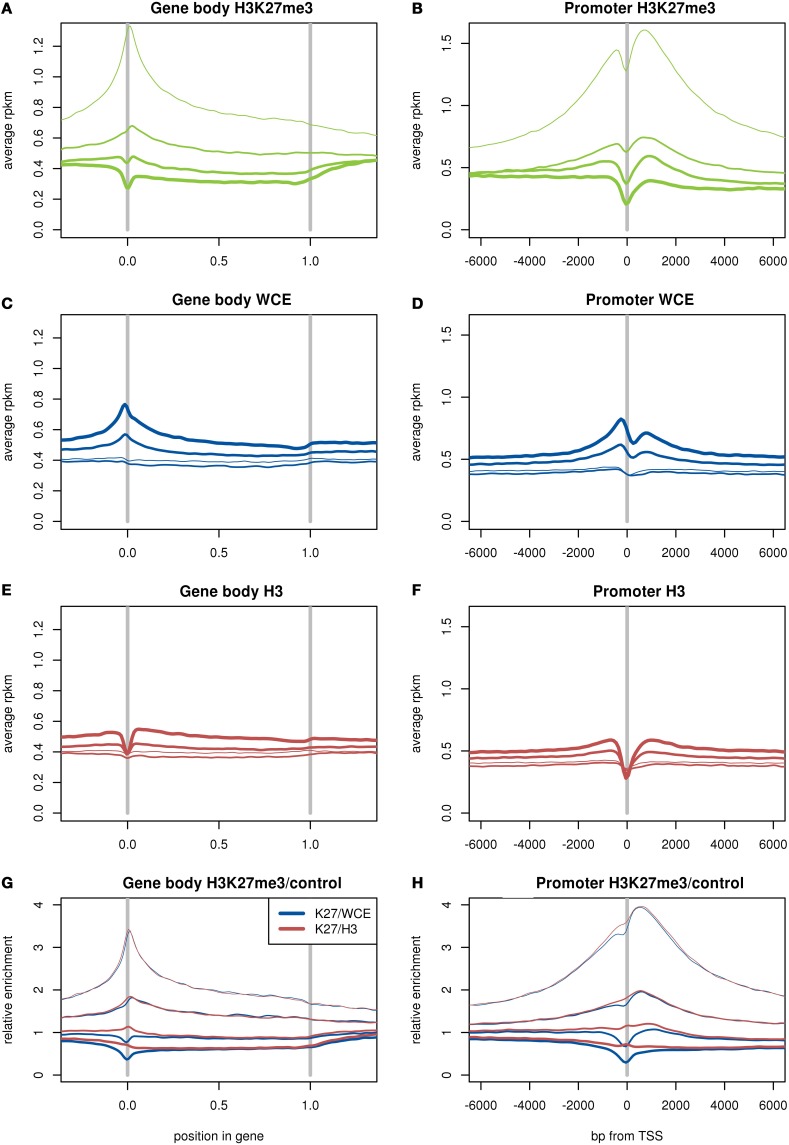
Figure 4.
Average read density in RPKM over genes (A,C,E) and around the transcription start site (B,D,F) for H3K27me3 (A,B), WCE (C,D), and H3 (E,F). Ratio of average read densities of H3K27me3 to the background sample over genes (G) and around the TSS (H). The genes are divided up into four equal groups based on expression (RPKM), shown by thin lines for lowest expression and thicker lines for higher expression. The two H3 samples and three H3K27me3 samples are merged.

