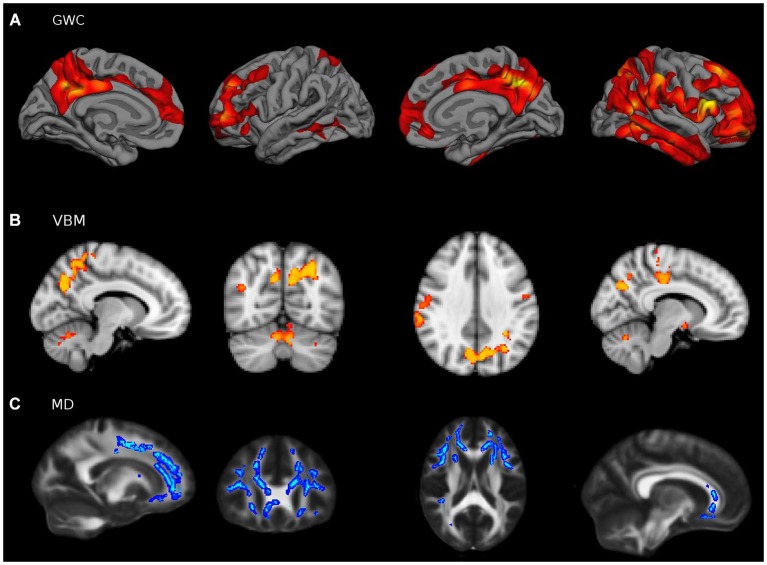
Figure 4.
Relationship (p < 0.05; FWE corrected) between mPFC-PCU DMN connectivity and (A) GWC (B) VBM and (C) MD. Positive relationships are shown on a Red-Yellow scale and negative relationship on a blue-lightblue scale. Both VBM and CTh showed a positive correlation with DMN connectivity, thus indicating preserved GM integrity with higher connectivity values. Mean Diffusivity showed a negative relationship with mPFC-PCU connectivity thus reflecting preserved MD integrity. For visual purposes, voxel significance is depicted in clusters that survived multiple comparisons. Gray-white matter contrast image is displayed by lateral and medial views of an inflated brain. Voxel-based morphometry slices are shown at x = −10,10; y = −66 and z = 34 and Mean Diffusivity slices are obtained in x = −18,20; y = 28, z = 18.

