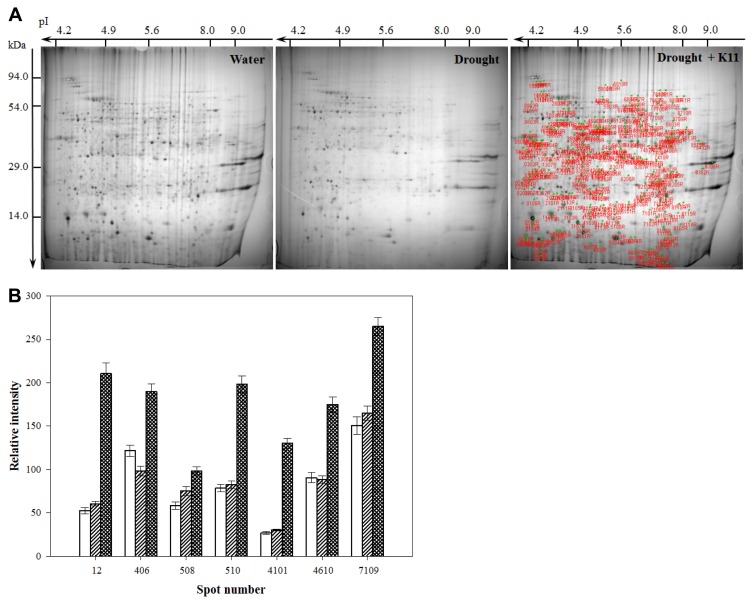
Fig. 2.
Proteome analysis of the drought stress-related proteins in pepper roots. Drought, drought stress alone for 10 days; Water, watering condition; K11, drought stress with B. licheniformis K11 inoculation (108 cell/pot). In the first dimention, 100 μg of protein was loaded on an 18 cm IPG strip with a linear gradient of pH 4.0 – 10.0 and SDS-PAGE gels were used in the second dimension. The red spots represent the proteins that showed significant differential expression under drought stress with B. licheniformis K11 inoculation as compared with water treatment (A). (B) The differential abundance of proteins was quantified using PDQuest software and plotted as the relative intensity. The white, tilt lines, and square bars indicate water treatments, drought stress without inoculation, and drought stress with inoculation, respectively. Values are the mean ± SE from three replicates. Statistical analysis was performed by ANOVA and Duncan’s multiple range test. Standard errors were determined at P ≤ 0.05.

