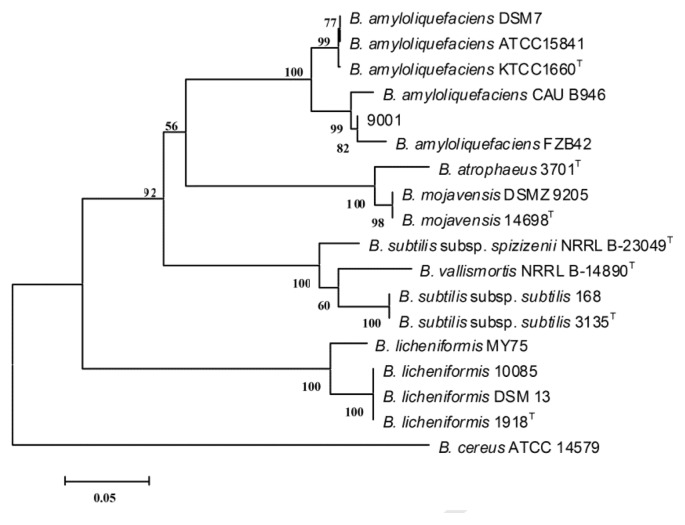
Fig. 3.
Rooted neighbor-joining tree based on partial gyrA nucleotide sequences. The percentage numbers at the nodes indicate the levels of bootstrap support based on neighbor-joining analyses of 1000 resampled data sets. The scale bar indicates 0.05 nucleotide substitutions per nucleotide position. Letter T marks type strains.

