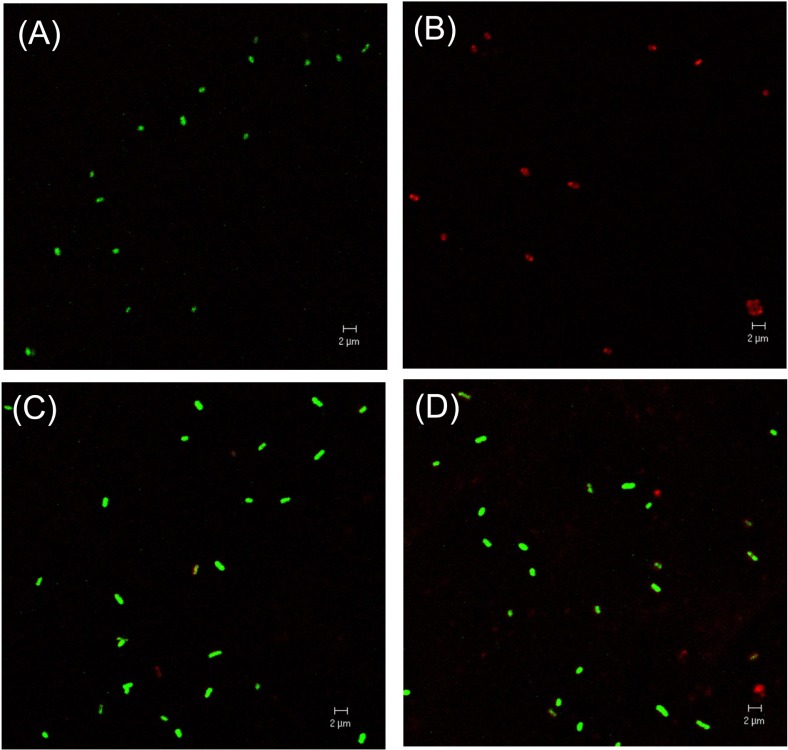
Fig. 2.
Confocal laser scanning micrograph of culturable and VBNC R. solanacearum. Images of SYTO-9 and PI were merged. (A), live cell control; (B), dead cells killed by isopropanol; (C), VBNC cells maintained for 1 day in microcosm; (D), VBNC cells maintained for 2 days in microcosm. Green cells and red cells represent viable and dead cells, respectively. Magnification was 1,600× and the bar represents 2 μm.

