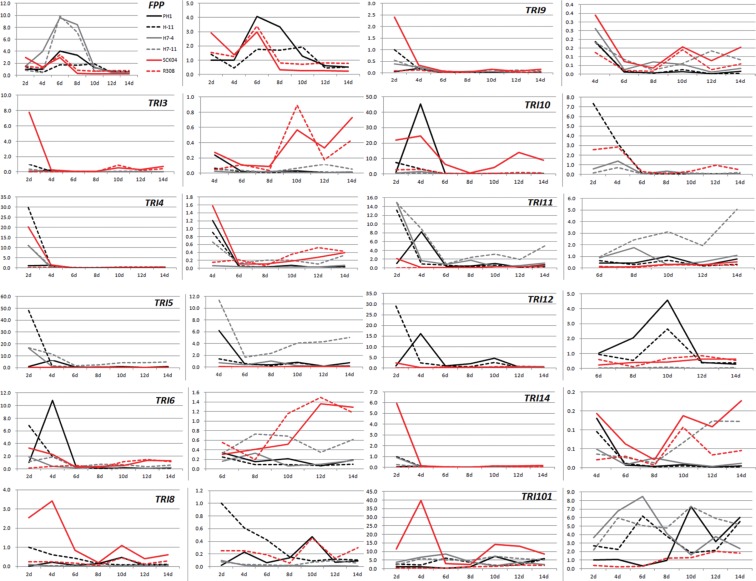
Fig. 2.
Transcript accumulation of individual TRI genes in agmatine-amended liquid medium based on qPCR. The x-axis represents days (d) after inoculation for trichothecene production in liquid medium. The y-axis represents relative amounts of transcripts. Data for each gene are shown in two separate graphs; left in each set show the entire graph, and an enlarged graph for the indistinct data is shown on the right. The positions and nucleotide sequences of the primers used in qPCR are shown in Table 1. Data shown are the mean values obtained from three independent biological samples, and detailed statistical information is shown in Table 2.

