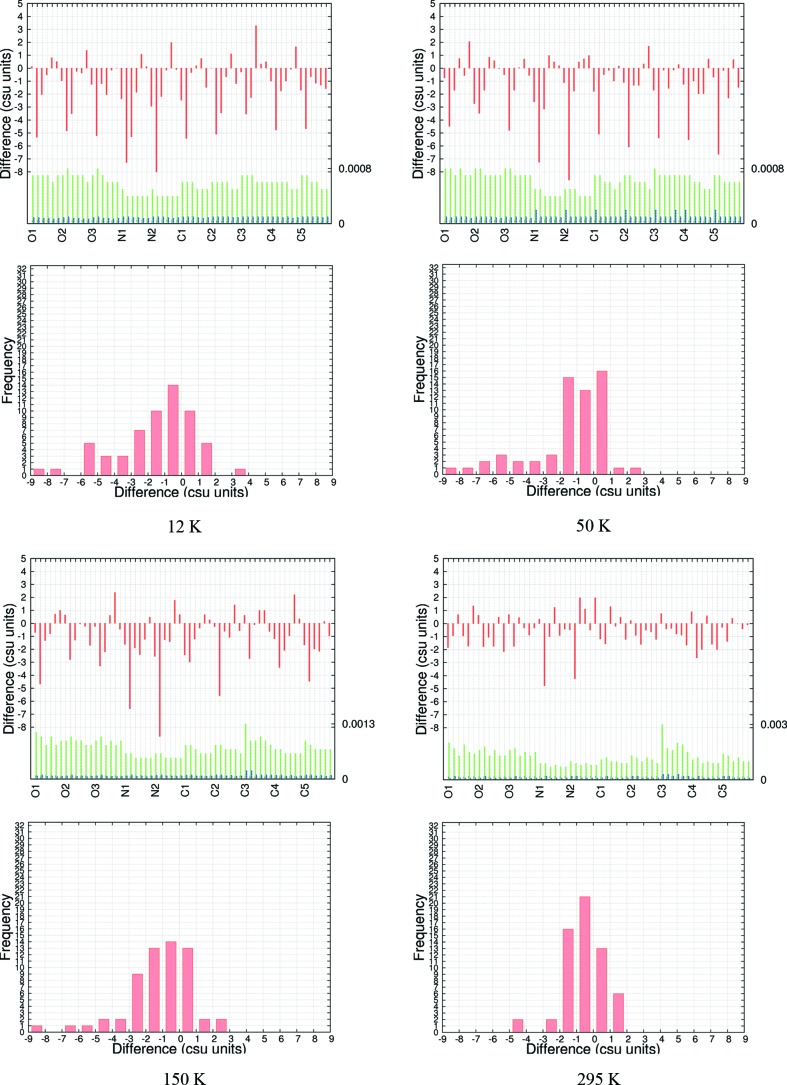
Figure 4.
Csu-weighted differences between X-ray and neutron measurements for non-H-atom ADPs, at four temperatures for the best model EDs at BLYP/cc-pVTZ. Rows 1 and 3: histograms with six entries (U 11, U 22, U 33, U 12, U 13, U 23) per atom. ADP su’s (Å2) are shown for neutron (green) and X-ray (blue) measurements; the maximum su value is shown on the right axis. Rows 2 and 4: frequency plots.

