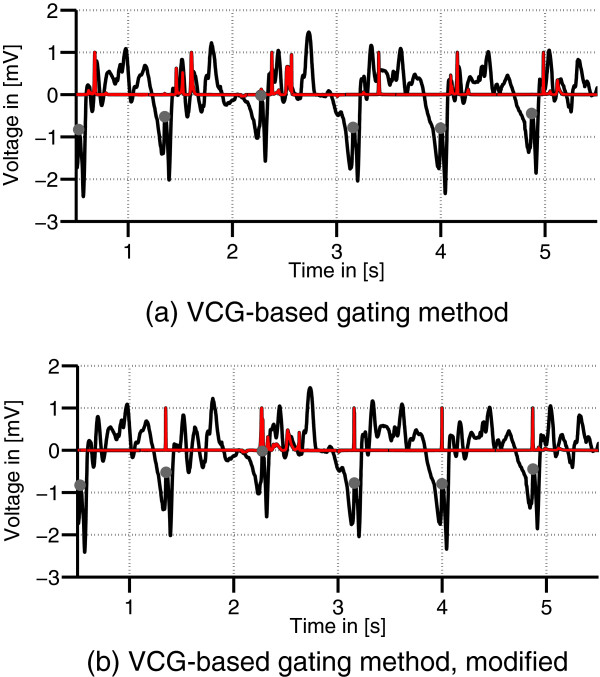
Figure 10.

VCG-based gating results. VCG lead z (black) of a 7 T record. The dots mark the R-peak positions. The red graph displays the result of the VCG gating algorithm (a) and of its modification using the different reference vector rout (b).

VCG-based gating results. VCG lead z (black) of a 7 T record. The dots mark the R-peak positions. The red graph displays the result of the VCG gating algorithm (a) and of its modification using the different reference vector rout (b).