Figure 4.

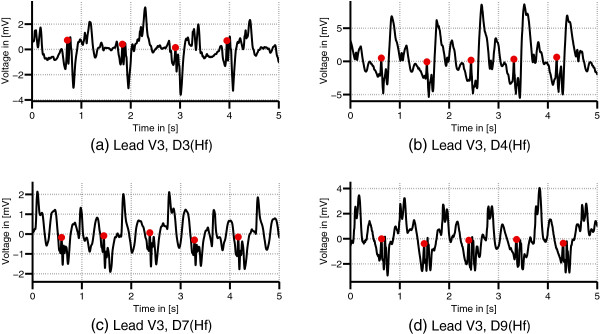
Variation of the MHD effect. ECG records (lead V3) from different volunteers acquired in the head first (Hf) position (a)-(d). The MHD effect varies between the different datasets. The dots mark the positions of the R-peaks.

Variation of the MHD effect. ECG records (lead V3) from different volunteers acquired in the head first (Hf) position (a)-(d). The MHD effect varies between the different datasets. The dots mark the positions of the R-peaks.