Figure 9.

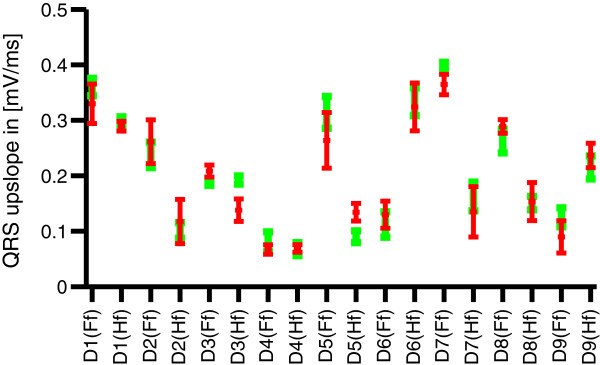
QRS upslopes. Mean and standard deviations of the QRS-upslopes for all datasets in (red) and of the corresponding IC (green).

QRS upslopes. Mean and standard deviations of the QRS-upslopes for all datasets in (red) and of the corresponding IC (green).