Figure 1.

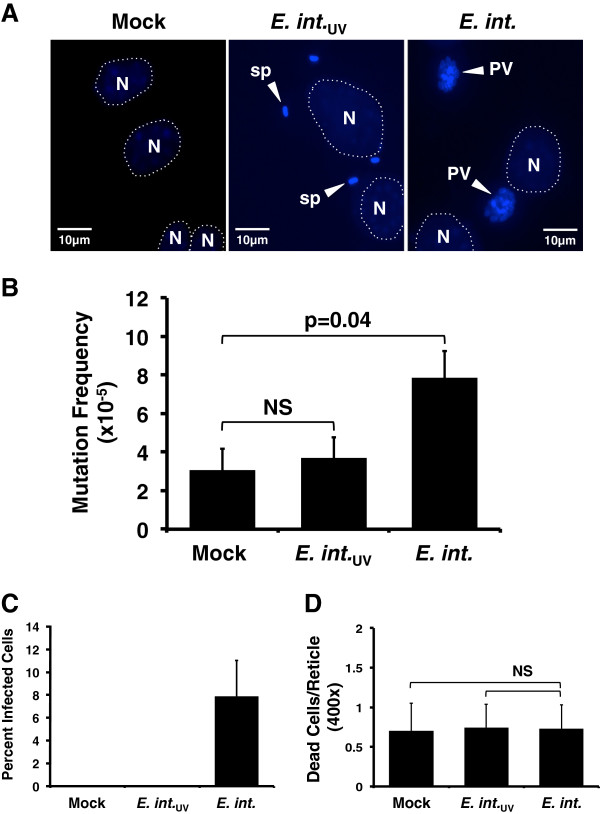
Productive E. intestinalis infection increases host cellular nuclear mutation frequency. BB-MEF cultures were: i) mock (mock)-infected; ii) E. intestinalis (E. int.)-infected 5 spores/cell, or iii) infected with ~5 spores/cell of UV-inactivated, E. intestinalis (E. int.UV) refed with DMEM, and incubated at 37°C. Panel A. Fluorescent micrographs from mock, E. intestinalis- or E. intestinalisUV-infected BB-MEFs at 42 hpi. Photographs were taken at 630× (oil immersion) using an ultraviolet filter for simultaneous visualization and morphological differentiation of DAPI-stained host cell nuclei and Uvitex-stained spores and parasitophorous vacuoles (PV), all of which appear blue. Because Uvitex-stained spores and PVs fluoresce comparatively more intensely, host cell nuclei are circled to improve visualization. Symbols: N = host cell nucleus; sp = spore; PV = parasitophorous vacuole. Scale bars are 10 microns. Panel B. At 42 hpi, 1 x 10⁷ cells were trypsinized, pelleted, quick-frozen, and stored at -80°C. Genomic DNA was purified using the RecoverEase DNA Isolation kit (Agilent Technologies, Inc.). Transpack (Agilent Technologies, Inc.) extracts were used to package genomic λ-phage DNA. Packaged phages were analyzed for cII mutation frequency as described. Panel C. At 42 hpi, BB-MEF cultures on coverslips were acetone:methanol fixed, stained with 0.01% Uvitex 2B (Polysciences, Inc.) and 1 ug/ml 4’,6-Diamidino-2-Phenylindole, Dichloride (DAPI; Life Technologies, Inc.), and mounted in Vectashield (Vector Laboratories, Inc.). Infectious foci and host cell nuclei were counted in 20 random 630x fields/coverslip using an Olympus BH-2 fluorescent microscope. Percentage of infected cells/reticle was then calculated. Panel D. At 42 hpi, BB-MEF cultures on coverslips were assayed using the “Live/Dead” cell viability kit (Molecular Probes, Inc.). Average number of dead cells/400x reticle in 20 random fields/group is plotted. In panels B-D, results average 3 replicates in 3 independent experiments. Means were compared with the unpaired Student’s t test using Microsoft Excel; p values < 0.05 = significant. NS = not significant.
