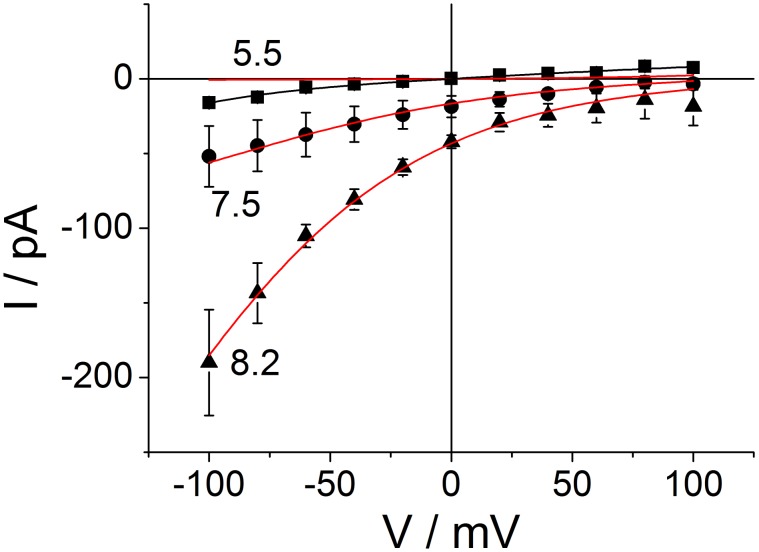
Figure 6. Fit of the data of Fig. 4 with the cyclic reaction scheme.
The lines give the fits by means of Eqs. S13–S15 in file S1. For pH 5.5, two fits are shown: red curve: joint fit with curves for cytosolic pH of 7.5 and 8.2, black curve: without the restriction by the joint fit. This is illustrated by two different “free” fits at pH 5.5 (Table 1, data columns 4 and 5), which show that different sets of rate constants can fit the curve.

