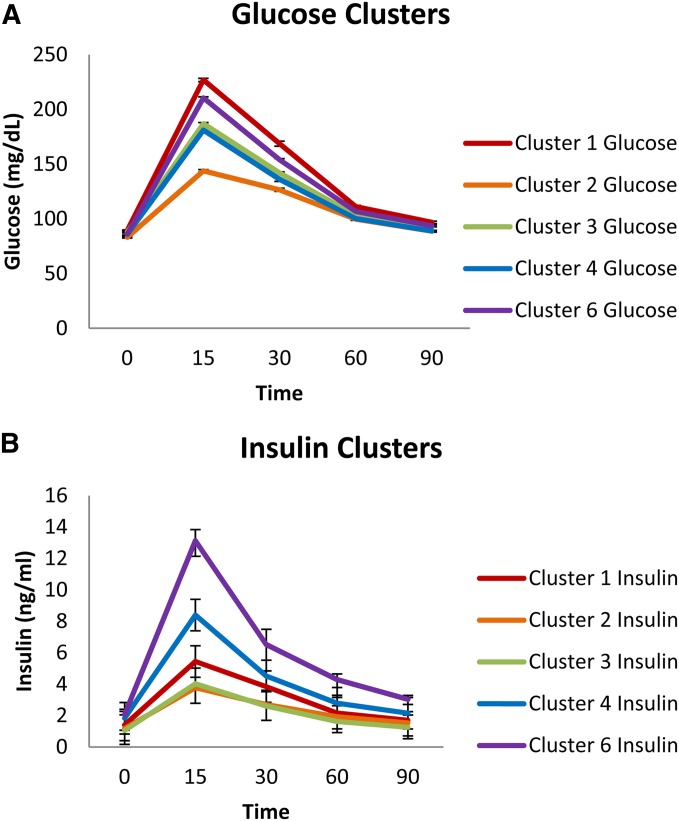
Figure 1.
(A and B) Cluster analysis of (A) glucose and (B) insulin levels during an intraperitoneal glucose tolerance test in >500 HS rats. Values are expressed in means ± SE. We identified six clusters based on glucose and insulin values. Because cluster 5 included only one animal, however, it is not included in the graphs or in subsequent analyses. Note that clusters with similar glucose values (clusters 1 and 6 or 3 and 4) have drastically different insulin values. Based on this cluster analysis, we selected animals for the expression analysis, choosing glucose intolerant HS from cluster 1 and HS with normal glucose from clusters 2 and 4.

