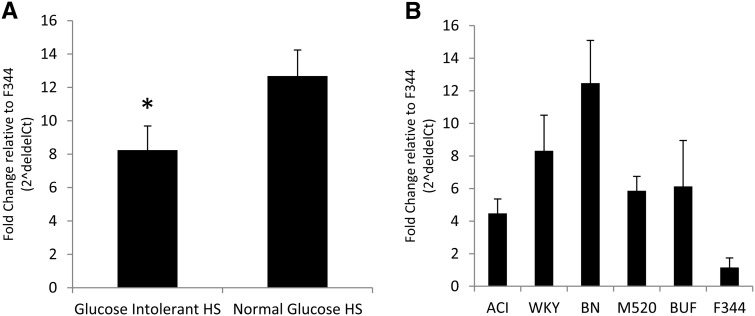
Figure 2.
(A and B) Differential expression of Tpcn2 by qRT-PCR in (A) HS rats and (B) HS founder substrains. Bars show the mean ± SE. Glucose intolerant HS rats exhibit an approximately twofold decrease in expression levels of Tpcn2 relative to HS rats with normal glucose levels (*P = 0.05). Large variation is seen in HS founder substrains with BN exhibiting the greatest levels of Tpcn2 and the F344 strain exhibiting the least. All fold-change differences are relative to the F344 founder strain. Note that the scales in A and B are the same.

