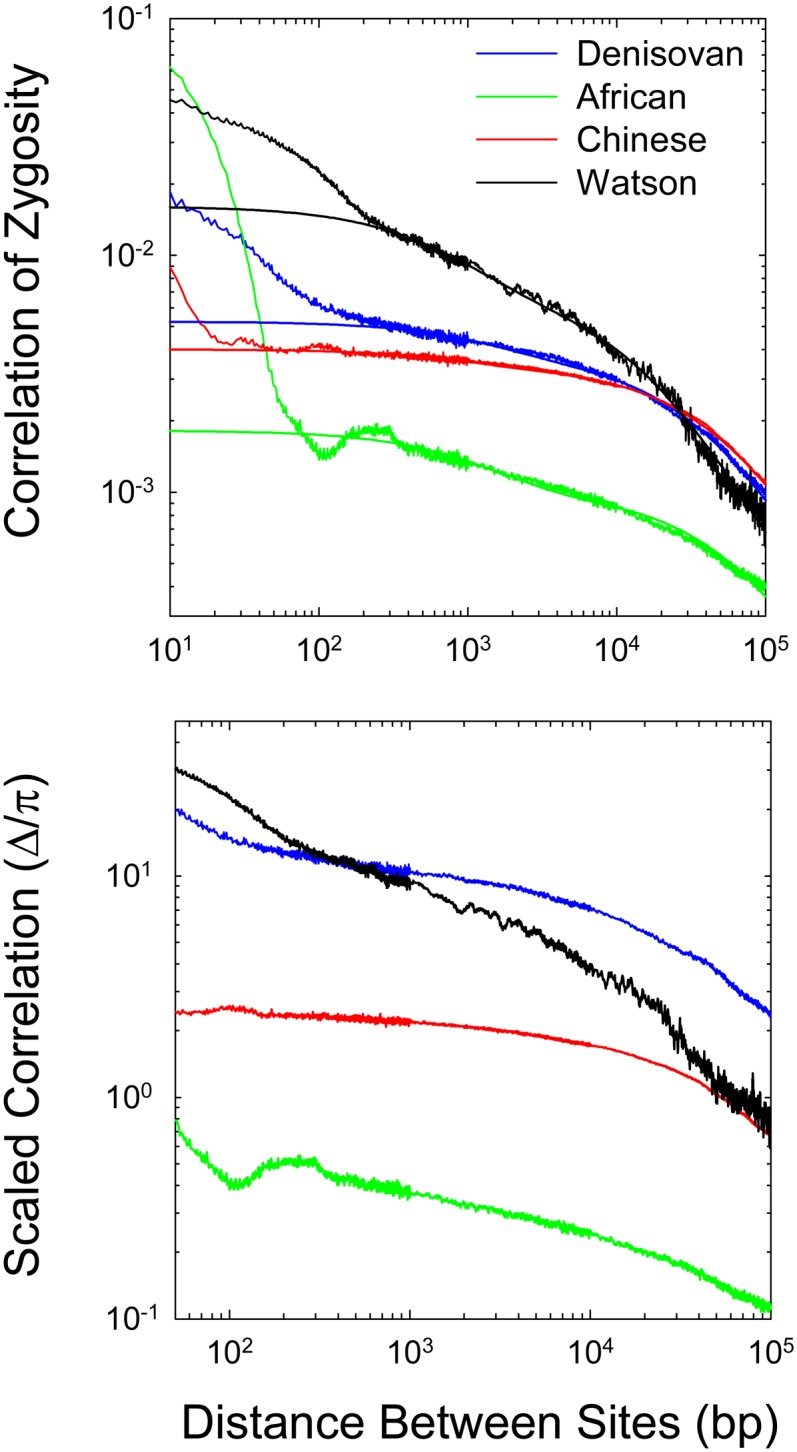
Figure 4.

The decline of the correlation of zygosity (Δ) with physical distance between sites, given for an archaic human (Denisovan) and three modern humans (African, Chinese, and Watson). (Top) The smooth lines are the fitted functions using sites separated by 250 to 105 bp as described in the text (with the fitted parameters given in Table 1). (Bottom) Behavior of the correlation scaled by the estimates of heterozygosity within each genome.
