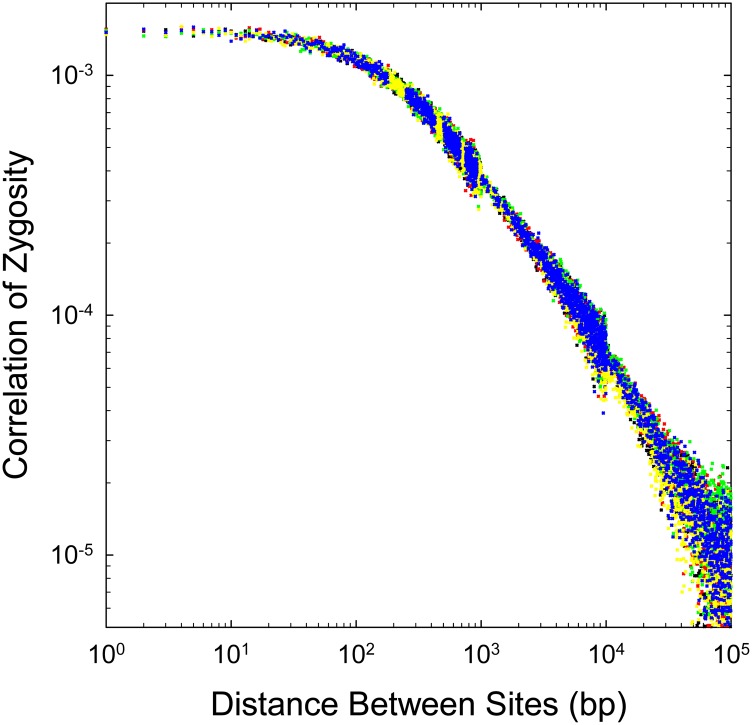
Figure 7.
Replicate Δ profiles for five simulated human genomes (different colored points), each using the same mutation and recombination parameters (averages from the four observed genomes): ρ1 = 4Nec = 0.0062, x = 0.17, , and θ = 0.0016. Estimates beyond a distance of 1000 bp are pooled (bins of 10 bp for 1–10 kb, and bins of 100 bp for >10 kb). Discontinuities in the range of variation arise at 1 and 10 kb owing to this averaging and the fact that the sampling variance of LD increases with physical distance between sites. Each of the five sets of observations were generated by independent coalescents, with 10× coverage in the subsequently generated sequence, and Δ being estimated with the program mlRho.

