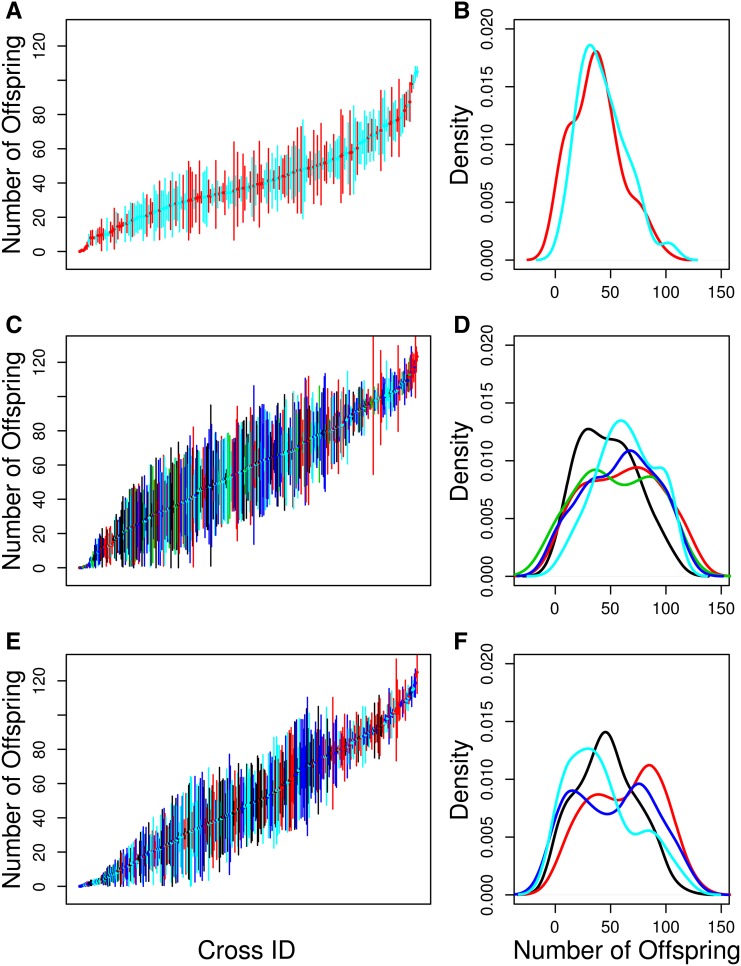
Figure 2.
The distribution of fecundity for carboplatin (A and B), gemcitabine (C and D), and mitomycin C (E and F). (A, C, and E) Means and standard errors of the number of offspring produced by each F1 female from each pA–pB cross. Different colors correspond to different weeks (blocks) of the experiment after removing weeks with poor dosing: black, week 1; red, week 2; green, week 3; blue, week 4; cyan, week 5. (B, D, and F) Density plot of the mean number of offspring produced by the three replicate females from each RIL. Different colors correspond to different weeks (blocks) of the experiment: black, week 1; red, week 2; green, week 3; blue, week 4; cyan, week 5.

