Figure 3.
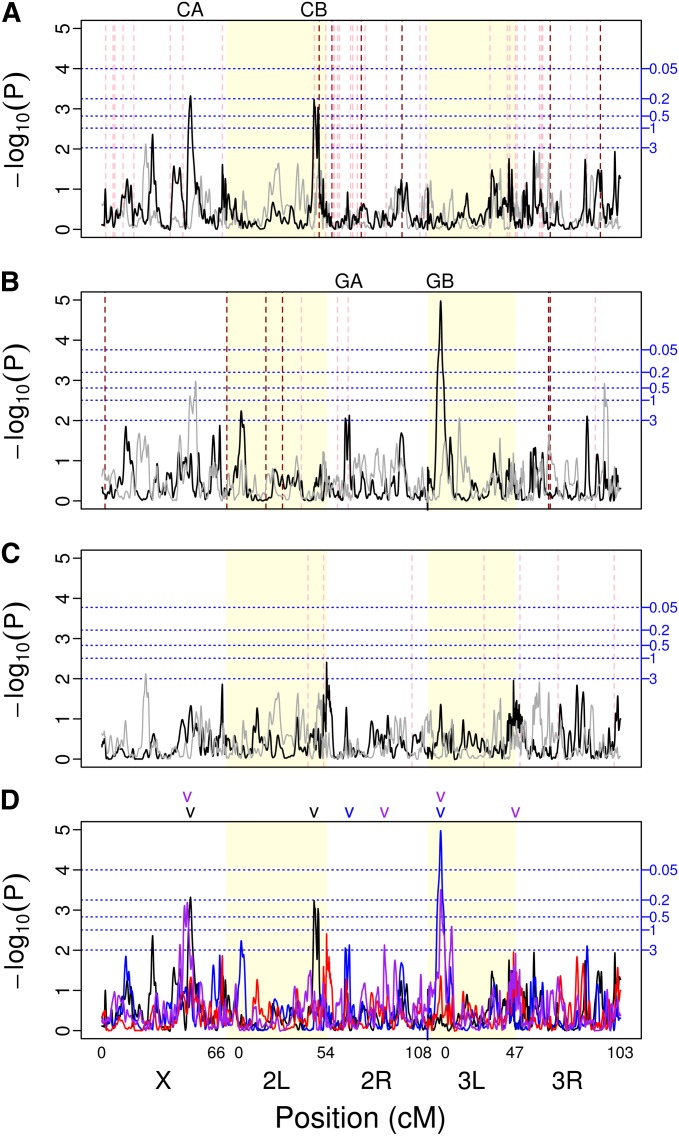
Genome scans for (A) carboplatin, (B) gemcitabine, (C) mitomycin C, and (D) all four drugs assayed in this experiment (black, carboplatin; blue, gemcitabine; red, mitomycin C; purple, methotrexate). The major chromosome arms are delineated by different background shading (white/yellow). The black line is the scan of the observed data. To give an example of the results obtainable by chance alone, the gray line is a scan of a single permutation of the observed data. Horizontal blue dotted lines indicate thresholds for various false-positive rates (number of expected peaks per genome scan) obtained via permutations (shown in A–C only). Vertical dashed red lines indicate the location of fly orthologs of previously identified candidate genes for each drug (shown in A–C only). The darker red indicates a gene in the drug pathway while the lighter red indicates all other candidate genes. The locations of mapped QTL are indicated above each plot. In the genome scan with all four drugs (D), different colors indicate QTL mapped for the different drugs (black, carboplatin; blue, gemcitabine; red, mitomycin C; purple, methotrexate).

