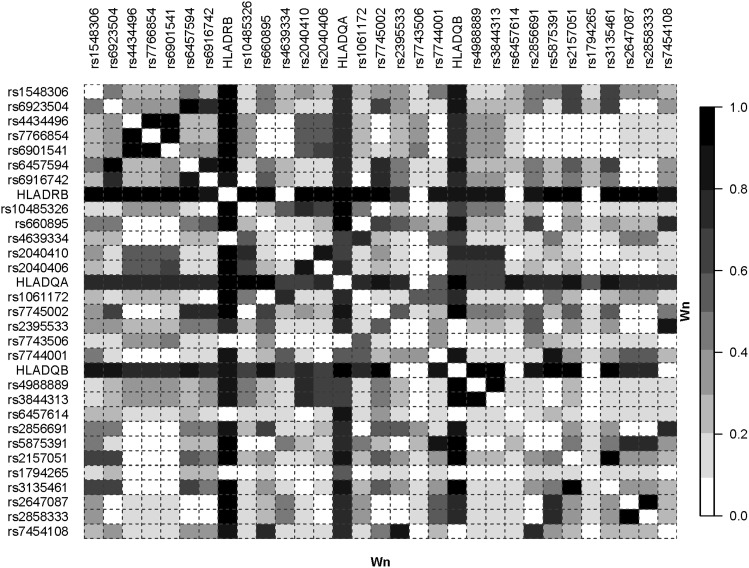
Figure 3.
The Wn measure applied to SNP and HLA–DRB1, DQA1, and DQB1 data. LD plot based on the Wn measure. The data are for 90 unrelated individuals from de Bakker et al. (2006) with European ancestry from the CEU obtained from the Tagger/MHC webpage.

