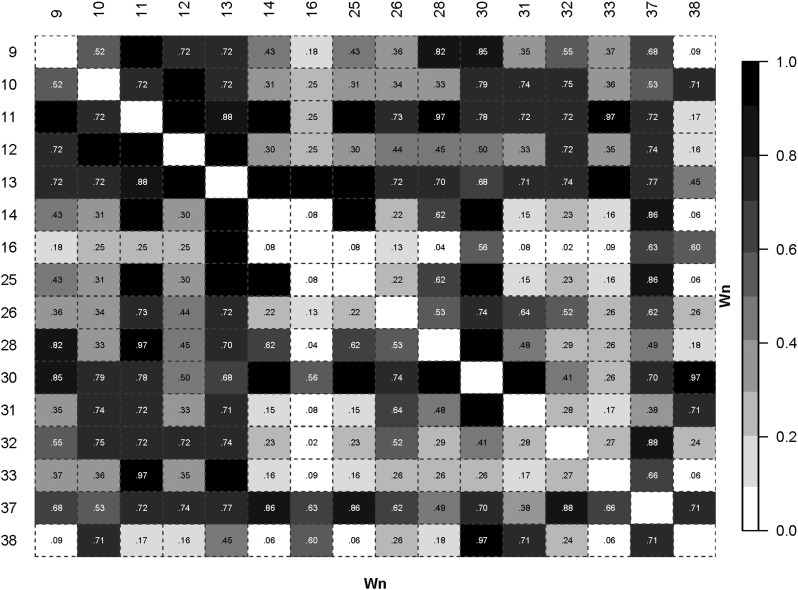
Figure 5.
The Wn measure applied to HLA-DRB1 AMINO Acids 9-38. LD plot based on the Wn measure. Black colored cells have a numeric value of 1. The data are for the control sample in a study of JIA.(Hollenbach et al. 2010; Thomson et al. 2010) For clarity, only amino acids 9-38 are shown.

