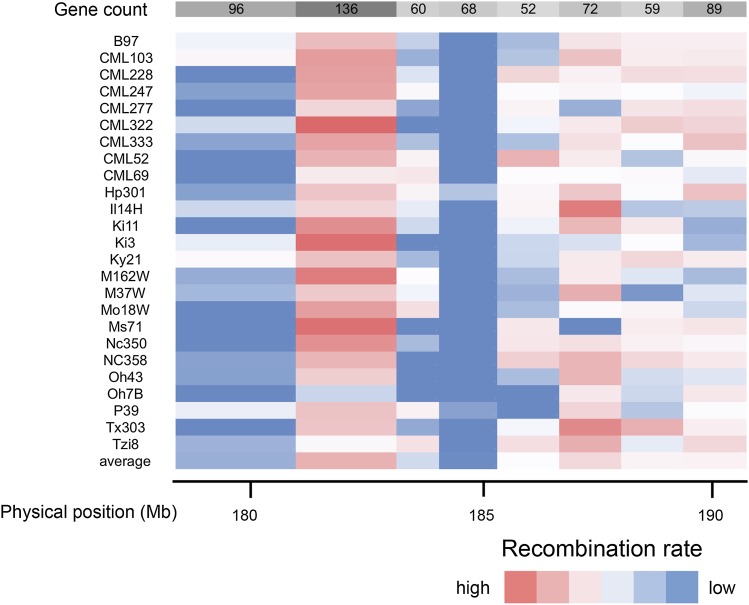
Figure 2.
Recombination rates across the fine-mapping interval. Recombination rates were calculated between nine markers for the NAM subpopulations. NAM founders are shown on the left and the gene counts for the eight subintervals are across the top. Red indicates regions of high recombination and blue indicates regions of low recombination.

