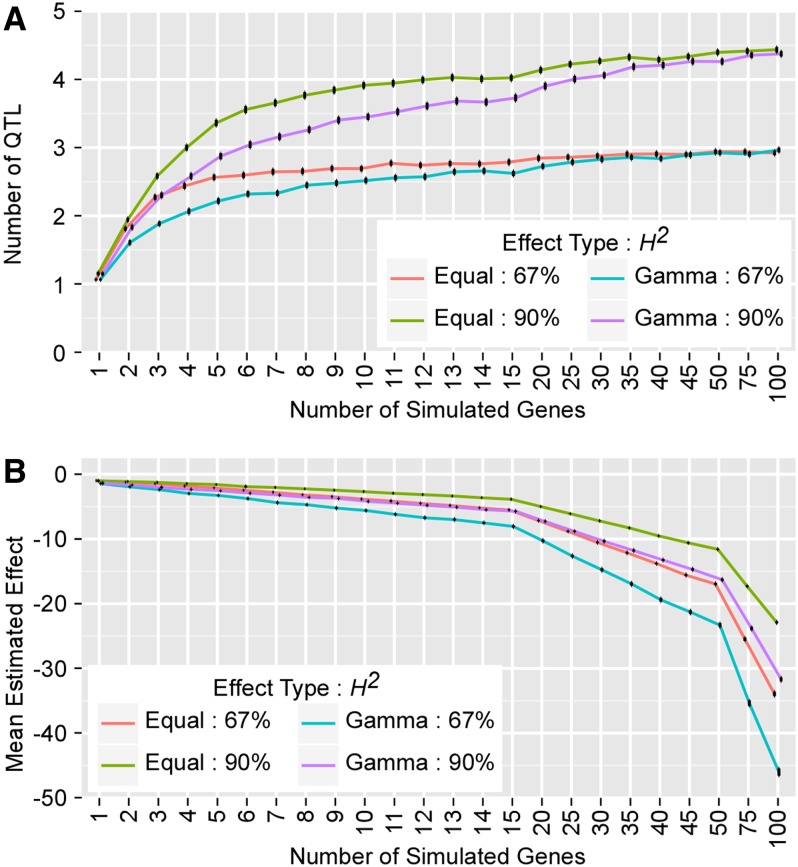
Figure 2.
The number of detected QTL and mean detected QTL effect size vs. number of simulated causative loci. Black lines indicate 95% confidence intervals. (A) Simulations consistently detect one QTL when a single causative gene is simulated, but when as few as three or four causative genes are simulated, we lose the ability to distinguish between genes. With high numbers of simulated causative genes, total QTL detected reach a ceiling of ∼4.5 QTL for simulated traits with 90% heritability and ∼3.0 for traits with 67% heritability. (B) The effects of unresolved genes are merged into the few large-effect QTL that are detected, consistent with the Beavis effect. This is seen in the negative correlation between mean estimated effect and number of causative genes.

