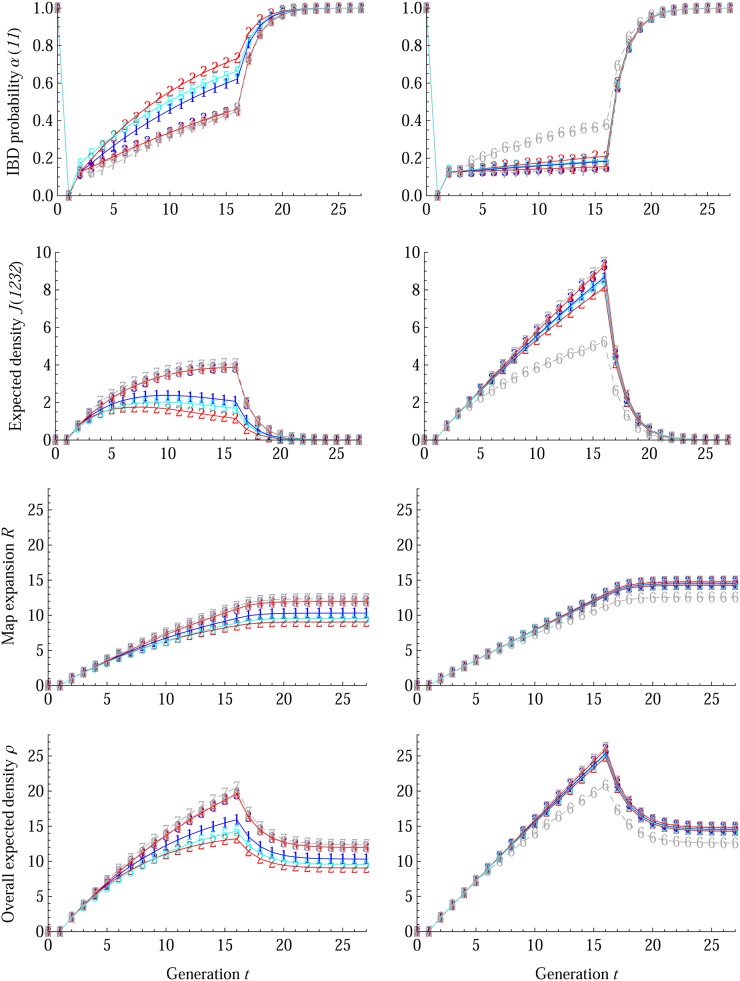
Figure 7.
Breeding designs on the intercross mating scheme ℳI in MAGIC populations with NF = 8, ℳF = RM1-NE, and ℳII = selfing. The intercross population size NI = 8 in the left column and NI =100 in the right column. The simulation results are denoted by integer markers for ℳI = (1) RM1-NE, (2) RM2-NE, (3) RM1-E, (4) RM2-E, (5) WF-NE, (6) CPM-E, and (7) MAI-E, respectively. The solid lines represent the theoretical results for the random intercross schemes, and dashed lines connect simulation results for the regular schemes (6) CPM-E and (7) MAI-E to guide one’s eyes. The blue color is for (1) RM1-NE and (3) RM1-E, red is for (2) RM2-NE and (4) RM2-E, cyan is for (5) WF-NE, and gray is for (6) CPM-E and (7) MAI-E.

