Figure 6.
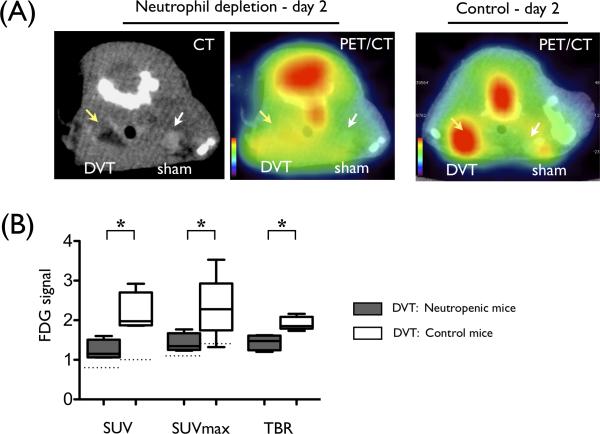
Experimental neutropenia reduces FDG signal within DVT. (A) Representative images of contrast-enhanced CT and fused PET/CT from neutropenic mice (left) and uninjected control (right) are shown. DVT (yellow arrow) and sham-operated jugular vein (white arrow) are indicated by arrows. (B) SUV, SUVmax, and TBR of FDG signal of DVT in neutropenic mice are significantly lower than control mice (*p<0.05). N=4 per group. Median SUV and SUVmax value of sham-operated contralateral jugular veins are shown as respective dotted lines.

