
Figure 2.
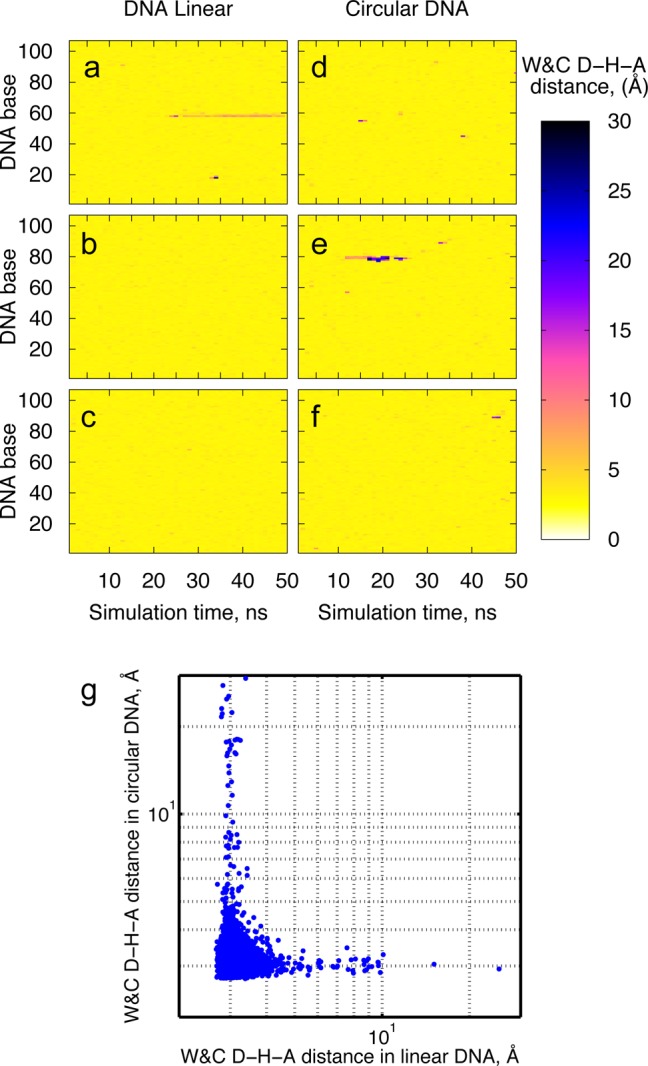
W&C D–H–A distance matrix for the linear and circular DNA: Panels a–c present results from the three independent simulation runs of the 107-bp linear DNA, and panels d–f represent the three independent simulation runs of the 107-bp circular DNA. Panel g shows the scatter plot of all instantaneous W&C D–H–A distances in the linear and circular duplexes sampled during the simulation.