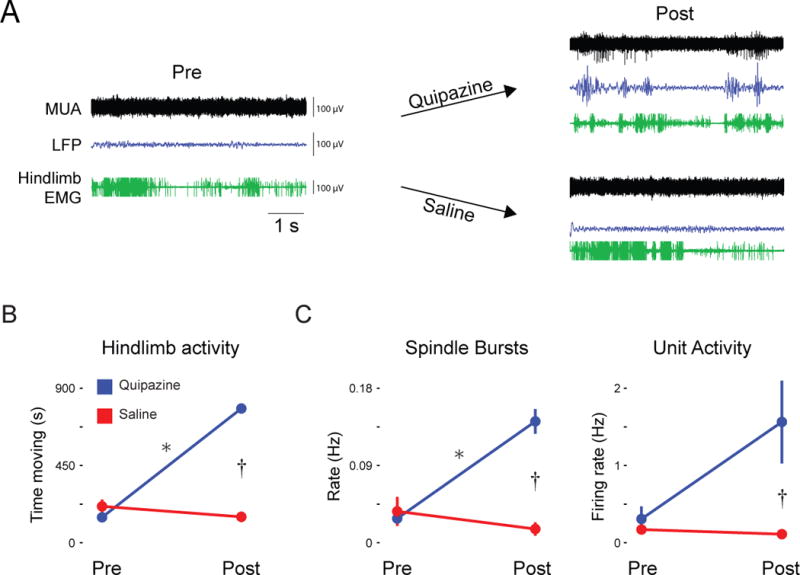
Figure 3. Pharmacological induction of hindlimb movements triggers M1 activity.

(A) Representative recordings in P8-10 subjects depicting multiunit activity (MUA; black traces) and local field potentials (LFP; blue traces) before and after intraperitoneal injection of the serotonin agonist, quipazine, or saline. Hindlimb EMG (green traces) is also shown. (B) Mean (± SEM) time that the hindlimb moved before and after quipazine or saline injection across all subjects (n = 6 per group). (C) Mean (± SEM) rate of spindle bursts (left; n = 6 per group) and unit activity (right; n = 4 per group) before and after quipazine or saline injection across all subjects. * within-subjects significant difference, P < 0.05; † between-subjects significant difference, P < 0.05.
