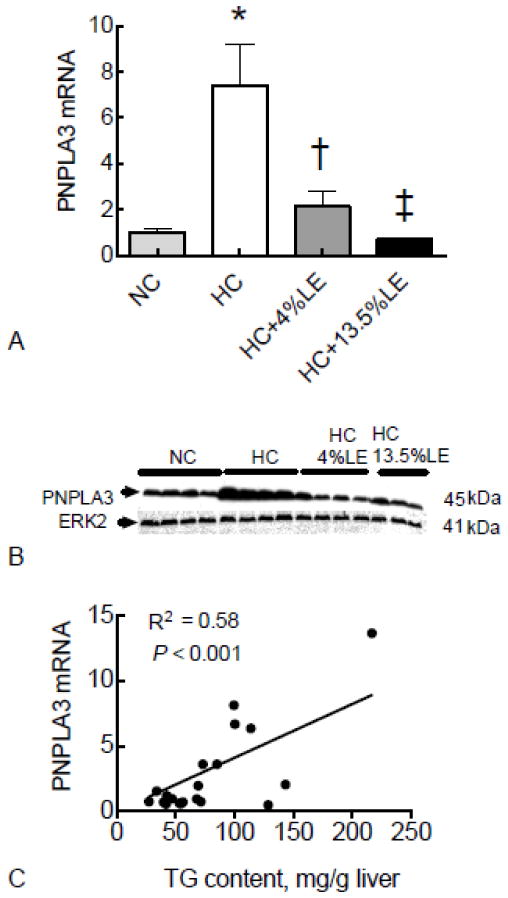
Fig. 1. Hepatic PNPLA3 gene expression is regulated by dietary carbohydrate-lipid fuel mixture in HC-fed mice.
Liver total RNA and protein were isolated from mice fed chow, HC diet, HC-4%LE diet, or HC-13.5%LE diet and subjected to real time PCR (A), and Western blotting (B) for PNPLA3. The correlation of liver total TG content and hepatic PNPLA3 expression for all groups was analyzed by regression analysis (C). For RT-PCR results, values were normalized to GAPDH mRNA for each sample and then expressed as the mean ± SEM (n=5), where the mean of the NC group was set to 1.00. * P < 0.001 vs. NC; † P < 0.05 vs. HC; ‡ P < 0.01 vs. HC.

