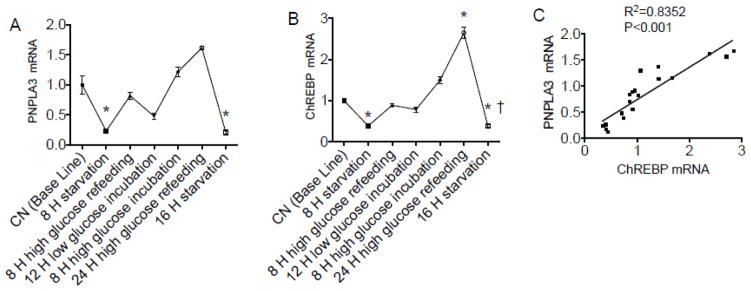
Fig. 4. PNPLA3 gene expression was regulated by glucose in HepG2 cells.

HepG2 cells were exposed to depletion-refeeding conditions in culture. Real time PCR was performed to determine mRNA levels of PNPLA3 (A) and ChREBP (B). The correlation of PNPLA3 and ChREBP was analyzed by regression analysis (C). The mean for the baseline group (A, B) was set to 1.0. A and B, * P < 0.05 vs. baseline; † P < 0.05 vs. 24 h high glucose refeeding.
