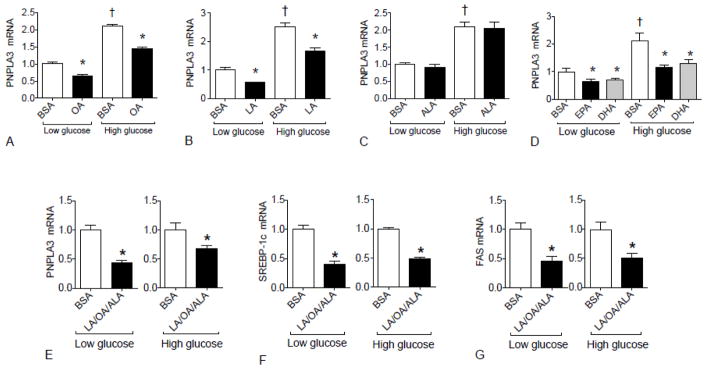
Fig. 6. PNPLA3 expression is regulated by unsaturated fatty acids in HepG2 cells cultured in low and high glucose media.

He pG2 cells were treated with 400 μM of the indicated individual fatty acids or the combination of LA, OA, and ALA (molar ratio: 6:3:1) or BSA alone either under low (5.5 mM) glucose or high (25 mM) glucose conditions for 24 h. RT-PCR analysis for PNPLA3 gene expression is shown for cells treated individually with OA (A), LA (B), ALA (C), or EPA or DHA (D), and with the mixture of LA, OA, and ALA in (E). SREBP1c (F) and FAS (G) were determined in cells treated with the mixture of LA, OA, and ALA. The mean for the albumin-treated control cells was set to 1.00. A, B, * P < 0.05 vs. BSA+Low glucose or BSA+High glucose; † P< 0.05 vs. BSA+Low glucose; C, † P < 0.05 vs. BSA+ Low glucose; D, * P < 0.05 vs. BSA+Low glucose or BSA+High glucose; † P < 0.05 vs. BSA+Low glucose; E, F and G * P < 0.05 vs. BSA.
