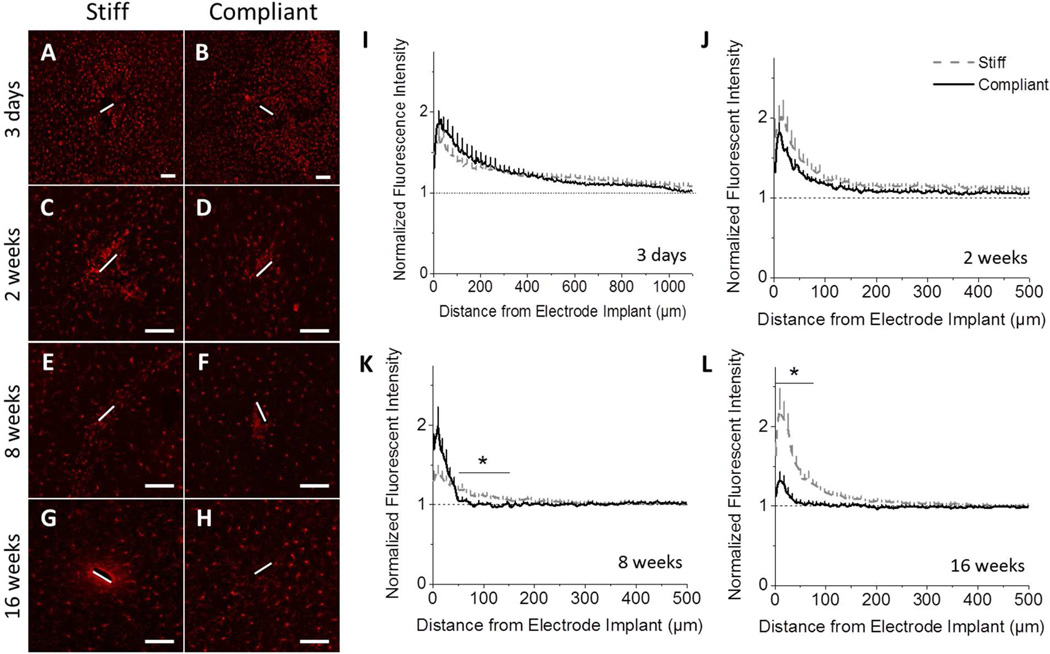
Figure 5.
Immunohistochemical analysis of total microglia/macrophages populations (Iba1). Representative fluorescence microscopy images of stained tissue show no effect of implant compliance at acute time points (3 days (A–B,I), 2 weeks (C–D,J)), but a significant increase in Iba1 immunoreactivity around stiff implants at chronic time points (8 weeks (E–F,K), 16 weeks (G–H,L)) (p < 0.05). Scale bar = 100 µm. Error bars represent standard error.

