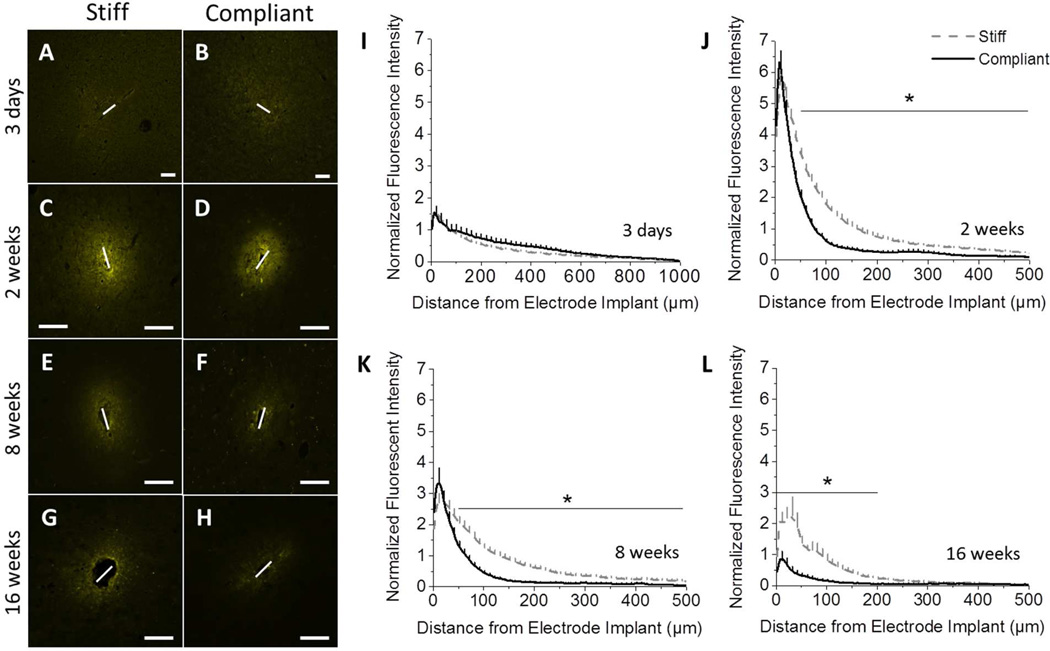
Figure 7.
Immunohistochemical analysis of IgG staining shows that the blood brain barrier integrity is improved for compliant implants, compared to stiff implants. Representative fluorescence microscopy images of IgG immunoreactivity show no difference three days post implantation (A, B). At all subsequent time points, a marked increase in IgG intensity was observed around the stiff implant (D, F, H) compared to the compliant implant (C, E, G). Quantification of the fluorescent intensity indicates significant differences between implants at 2, 8, and 16 weeks post implantation (J–L). (p < 0.05). Scale bar = 100 µm. Error bars represent standard error.

