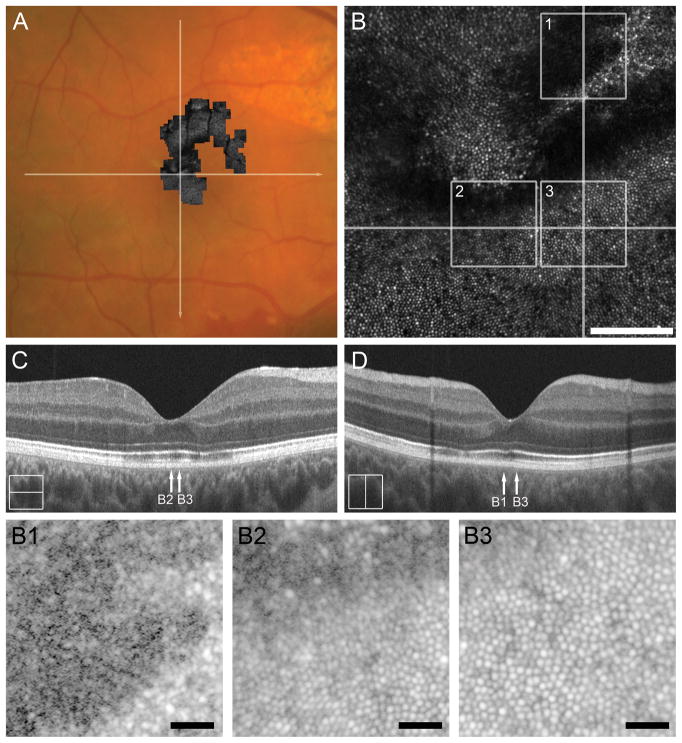
Figure 4.
Case 4, DW_0665. Reflectivity of the IZ band on SD-OCT correlates to degree of photoreceptor mosaic disruption 7 months after cgBOT. A. Color fundus photograph of the right eye showing the full extent of AOSLO montage with white arrows indicating the location of the SD-OCT scans in C and D. The central portion of the AOSLO montage (B) shows disruption of the foveal and perifoveal photoreceptor mosaic, with sharp boundaries between normal and abnormal cone mosaic. Numbered white boxes indicating the position of the AOSLO insets (B1 to B3), and white lines again indicate the position of SD-OCT line scans (C, D). Scale bar = 100 μm. AOSLO insets B1 and B2 show disruptions in the cone mosaic that correspond to the locations of an attenuated IZ band (arrow B1 and B2 in C and D). AOSLO inset B3 shows a normal contiguous cone mosaic corresponding to a location of normal retinal lamination (arrow B3 in C and D). Scale bars in AOSLO insets B1–B3 = 20 μm.

