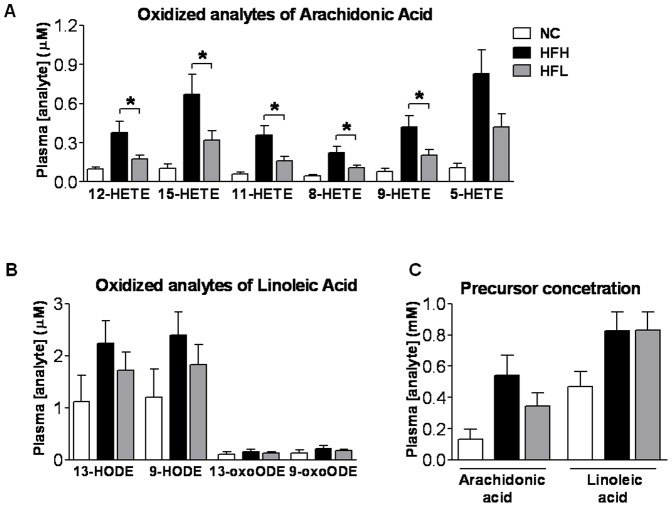
Figure 4. Plasma concentration of the major ω6 fatty acids and their corresponding pro-inflammatory metabolites.
The effect of varying dietary ω6/ω3 ratio in high fat diet-fed WT mice on plasma concentrations of oxidized metabolites of (A) arachidonic acid and (B) linoleic acid. (C) Plasma concentrations of arachidonic and linoleic acids. NC n = 3 (open bars), HFH n = 7 (black bars), HFL n = 8 (gray bars). T-test analysis was restricted to HF diet animals only. Values are mean ±SE. *P<0.05 HFH vs. HFL. NC, normal control (chow); HFH, high dietary ω6/ω3 ratio; HFL, low dietary ω6/ω3 ratio; HETE, hydroxyeicosatetraenoic acid; HODE, hydroxyoctadecadienoic acid; oxoODE, oxooctadecadienoic acid.

